Panopta Monitors
The built-in Panopta Monitors trigger initiates a flow when it receives a signal from a Panopta monitor.
Add the Panopta Monitors trigger to the canvas
- Go to the Triggers tab in the palette, expand the App Triggers section and drag the trigger onto the canvas.
- Double-click the trigger (or click the pencil icon).
- Set the authenticating user, and then copy the URL and Configuration Payload — you'll use these to set up a webhook in Panopta. Alternatively, you can create an integration user to use as the authenticating user.
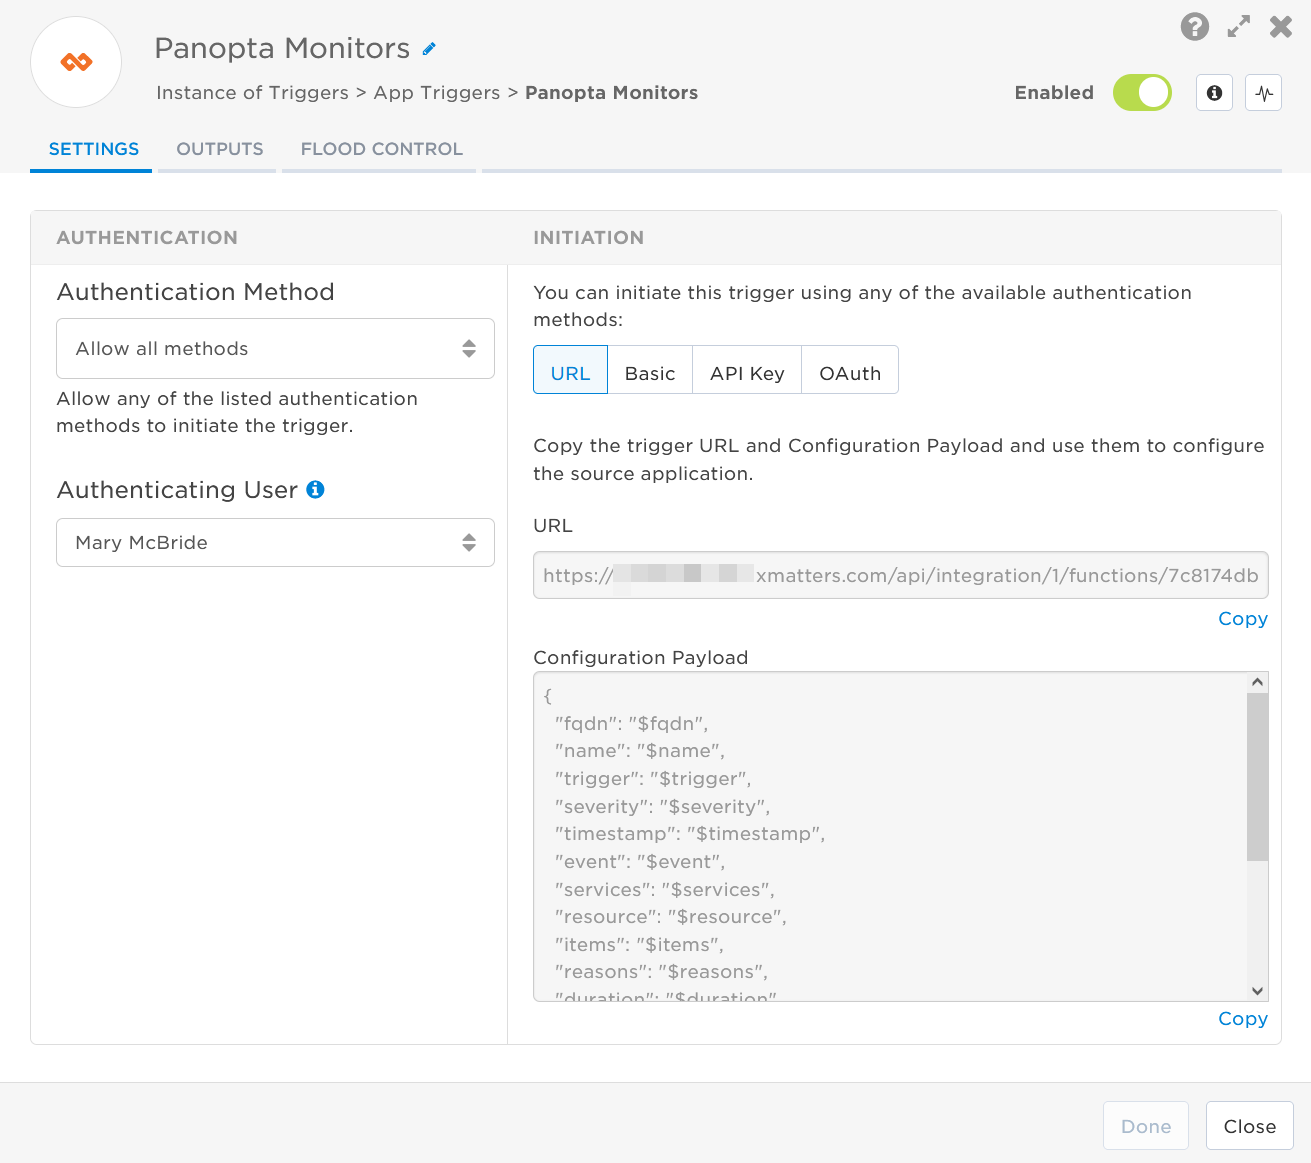
- Click the Flood Control tab to edit the trigger's default flood control settings. For more information about these settings, see Trigger Flood Control.
- Click Done.
- On the flow canvas, connect the steps you want to run when xMatters receives a request to that URL.
You're now ready to configure Panopta to target the trigger.
Configure Panopta to send requests to the trigger URL
To have Panopta send alerts to the flow trigger, you need to configure a webhook and set it to use the trigger URL.
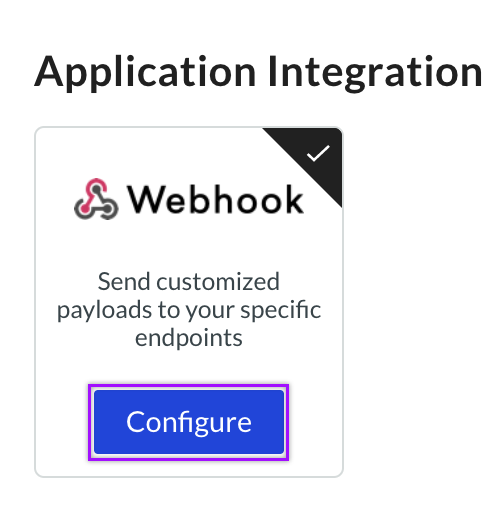
- In Panopta go to Settings > Integrations.
- Under Webhook, click Configure.
- Fill in the following fields on the webhooks screen:
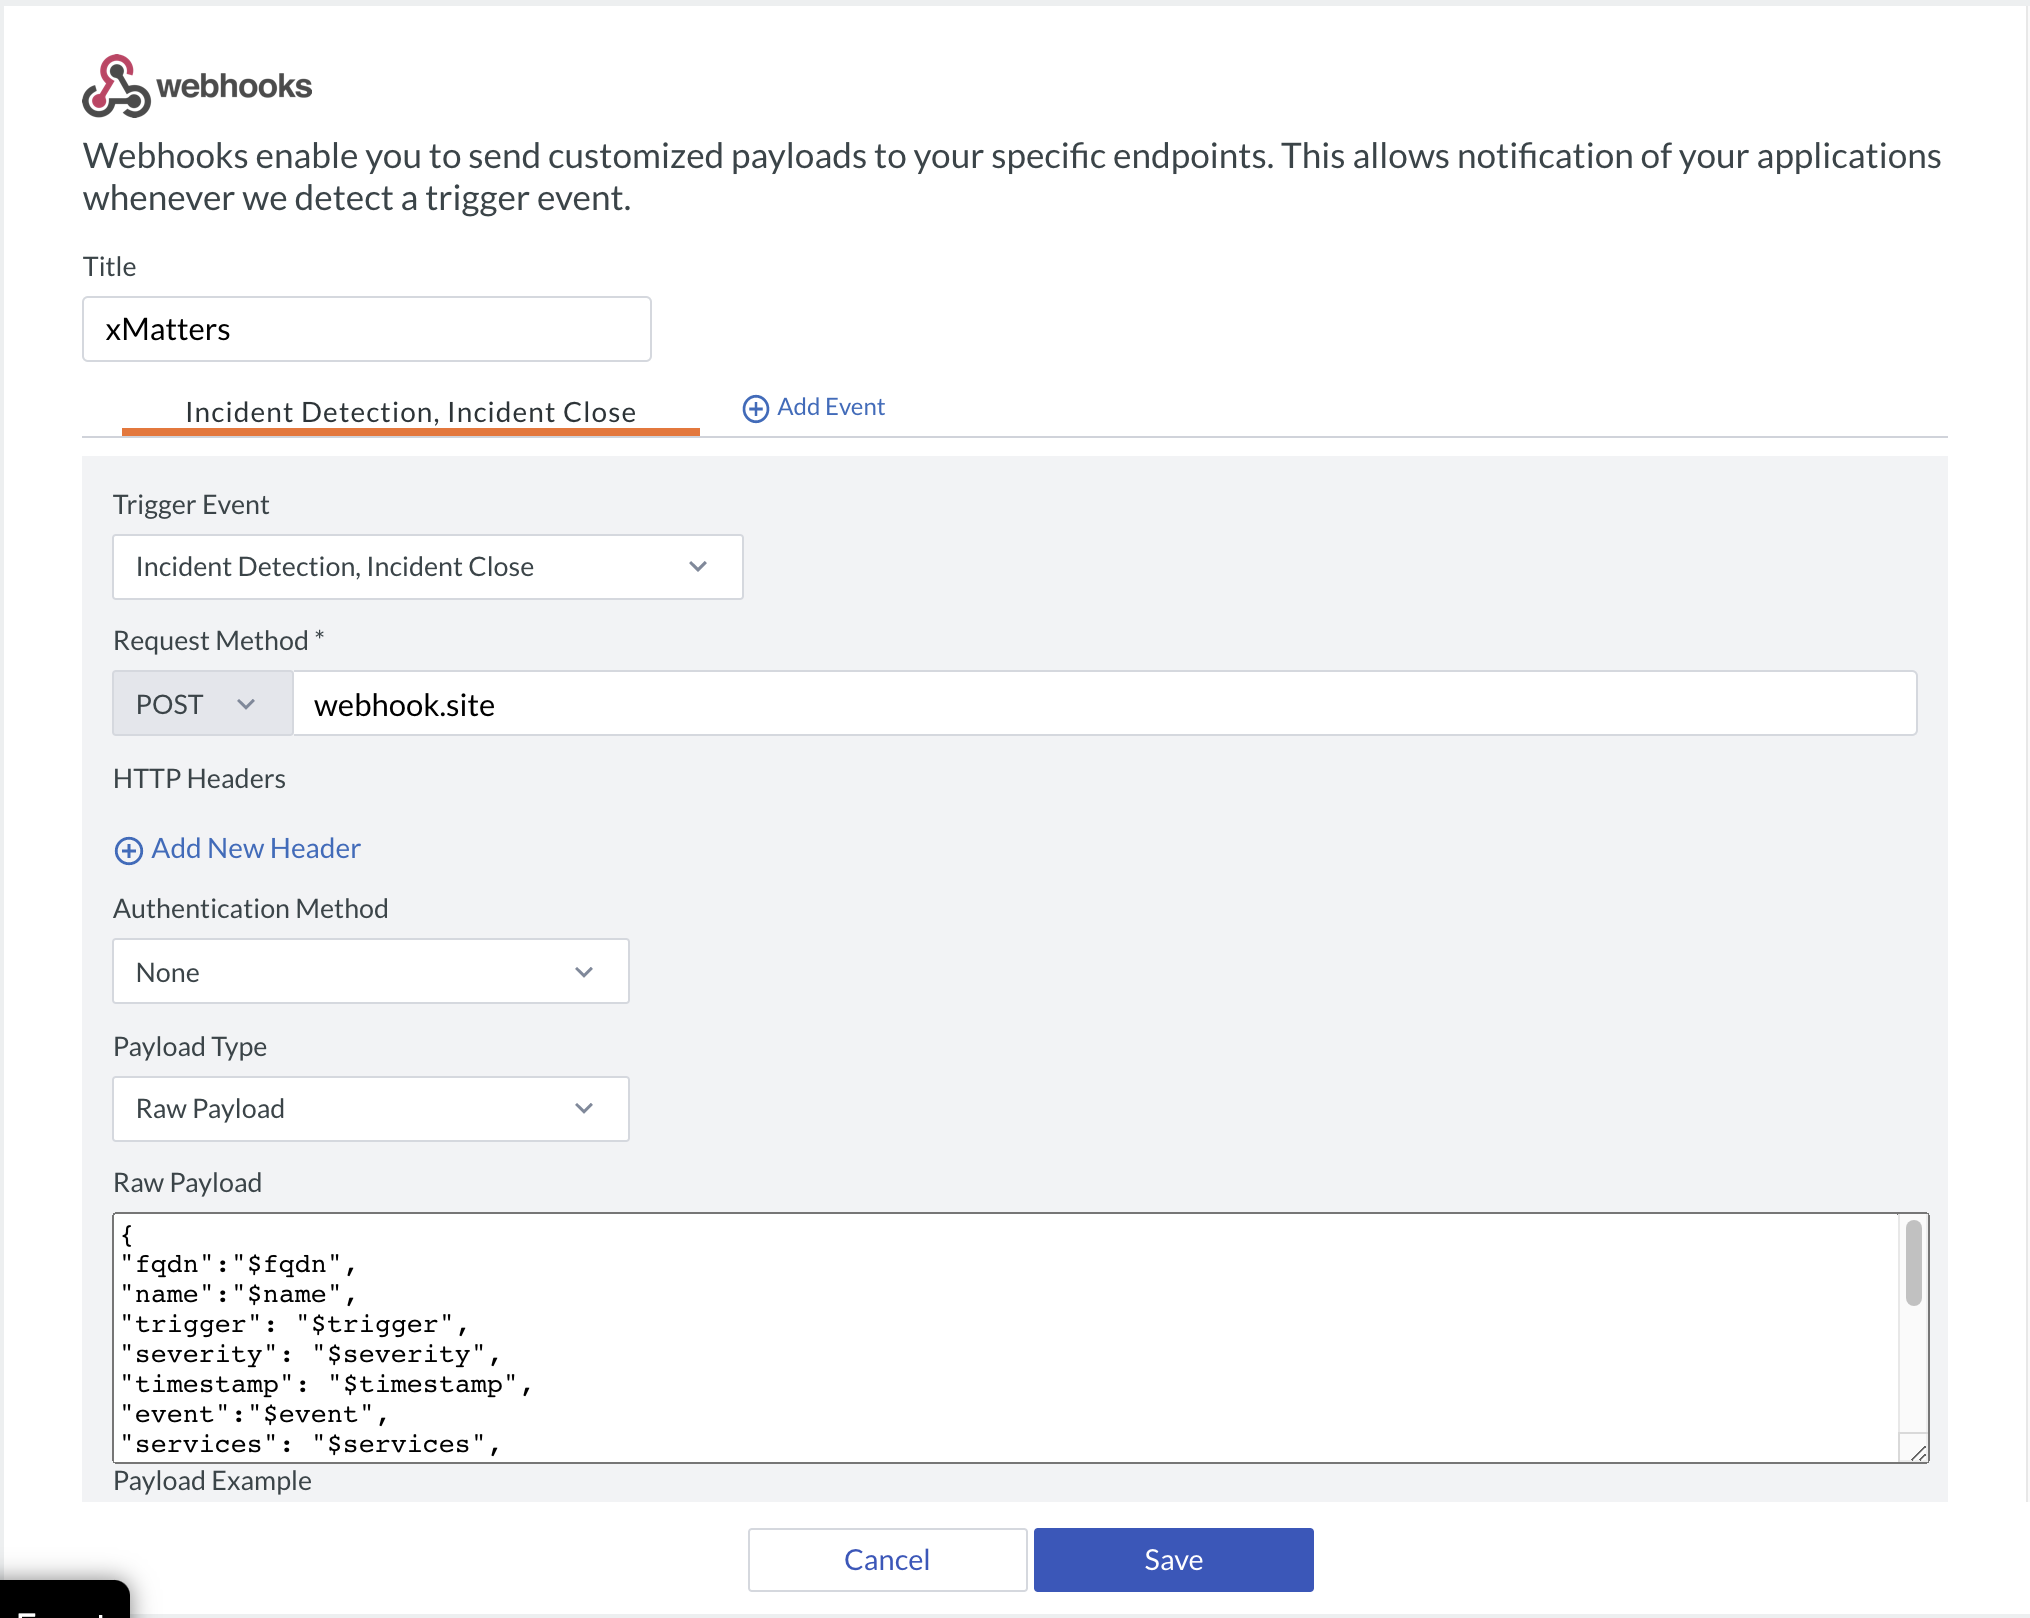
- Title:xMatters
- Trigger Event: Expand the drop-down menu and select Incident Detection and Incident Close.
- Request Method: Paste the trigger URL you copied from Flow Designer. Add the target names of any recipients you want to notify when the alert fires to the end of the URL.
- For URL authentication, use an ampersand to attach recipients. For example, if you want to notify Emma Pearson and the on-call members in the group responsible for the Antares service, you'd add &recipients=epearson,antares to the URL.
- For other authentication types, use a question mark to attach recipients. For example, if you want to notify Barry Gull and the on-call members in the group responsible for the Cassiopeia service, you'd add ?recipients=bgull,cassiopeia to the URL.
- You must URL-encode any special characters or spaces in the target names.
- Payload Type: Expand the drop-down menu and select Raw Payload.
- In the Raw Payload field, insert the Configuration Payload you copied from the Panopta trigger in Flow Designer.
- Click Save.
You'll now need to add the webhook to an alert timeline.
- In Panopta go to Monitoring > Alert Timelines.
- Select the Alert Timeline you want to add the alert to.
- Click Add New Alert Event.
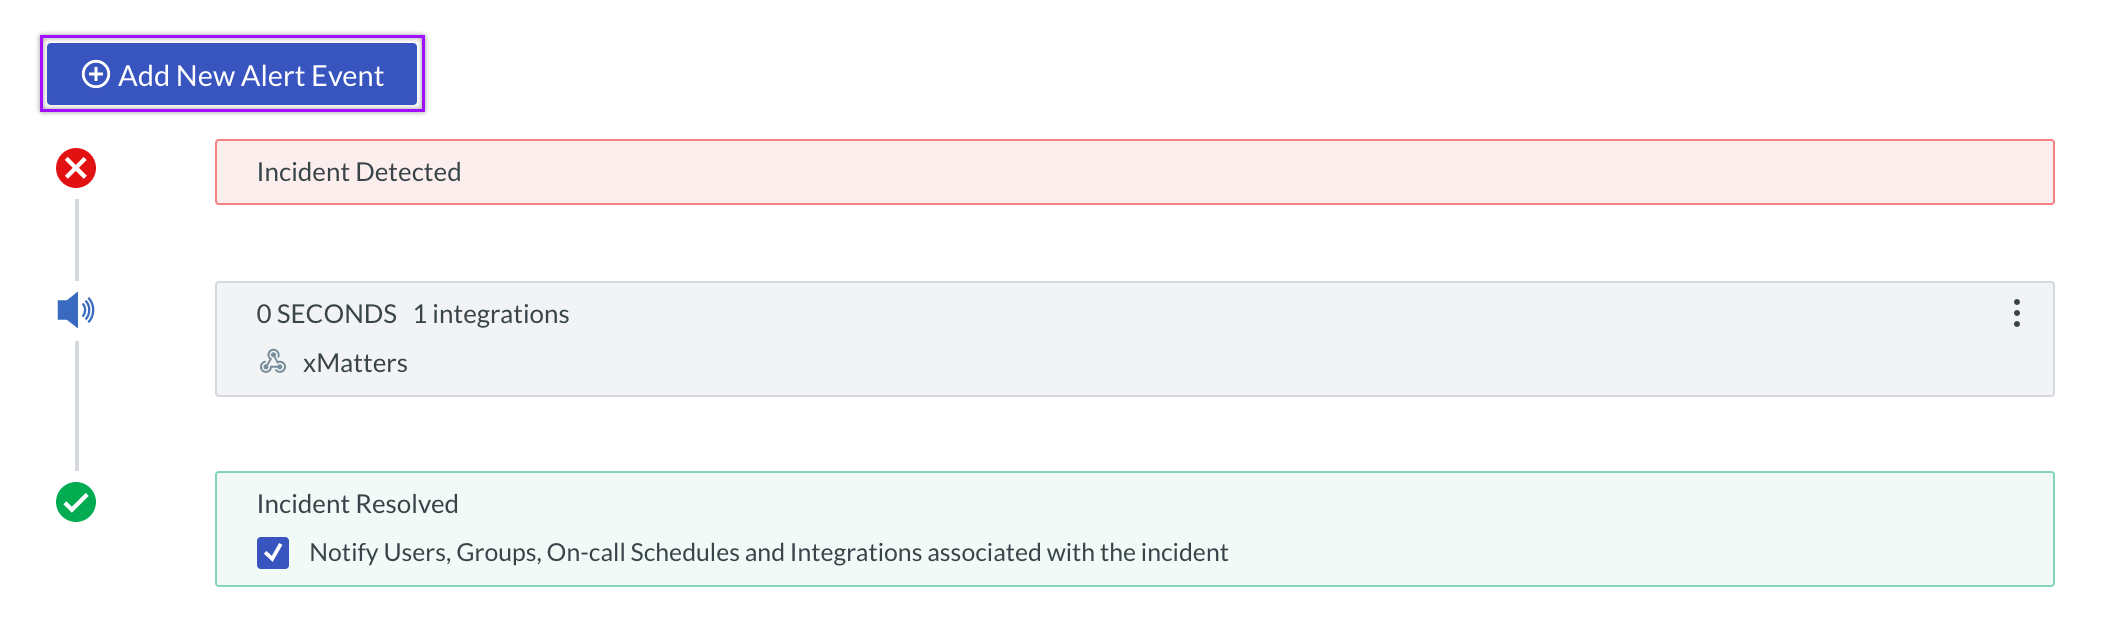
- Configure the Trigger Time by selecting hour, minutes, and seconds from the drop-down menu.
- In the Integrations drop-down menu, select xMatters.
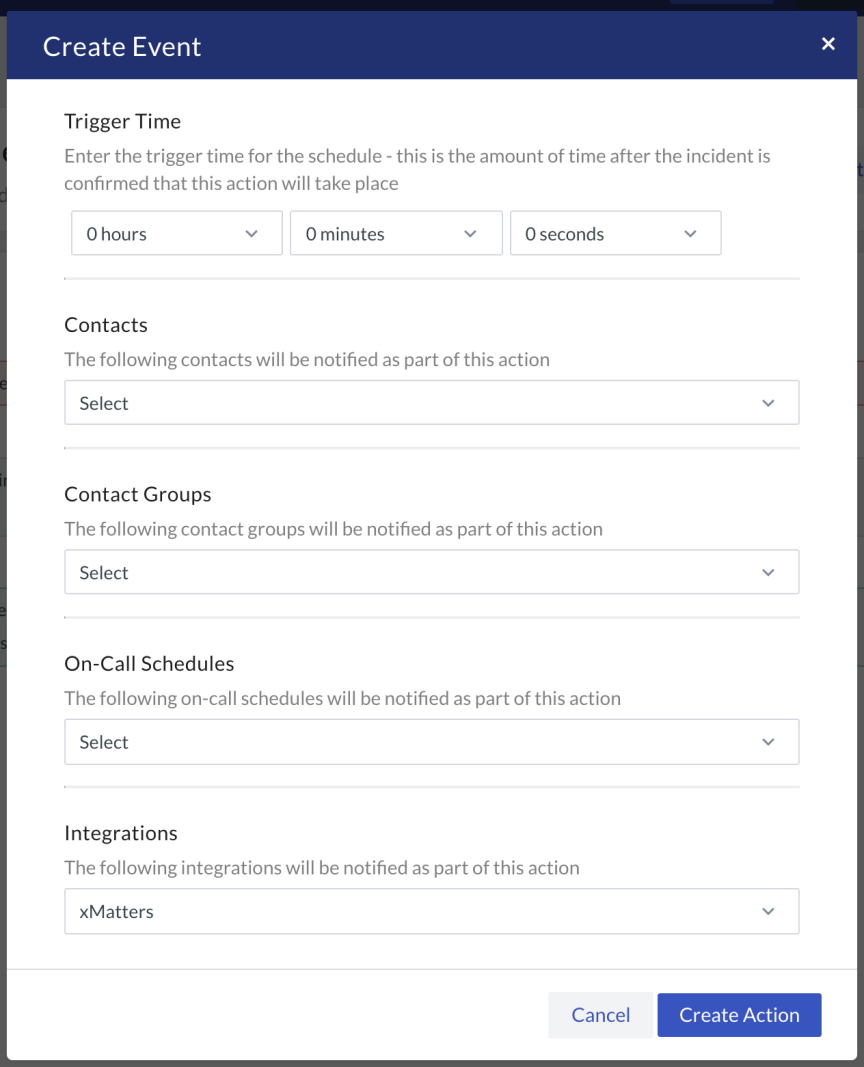
- Click Create Action to add it to the alert timeline.
You're ready to use the webhook to trigger automated flows, including steps such as sending alerts and initiating incidents, though we always recommend testing before putting things into use.
Outputs
The trigger has the following outputs you can use as inputs to steps further along the flow.
|
Label |
Description |
|---|---|
| Recipients | List of targeted recipients. Recipients are set by adding a recipients query parameter to the trigger URL when you configure the webhook in Panopta. |
| Signal Mode | Determines the flow path to follow, based on the value of the Trigger parameter. |
| Signal ID | Key or identifier used to terminate or correlate events/signals. |
| Fully Qualified Domain Name | Domain name of the server that triggered the alert. |
| Name | Name of the server that triggered the alert. |
| Reasons | Detailed reason for the alert as provided by Panopta. |
| Severity |
Severity of the alert in Panopta. Available values are:
|
| Tags | Comma-separated list of tags for the Panopta server. |
| Timestamp | Timestamp of when the Panopta incident began or was cleared. |
| Trigger |
The type of event that triggered this payload. Available values are:
|
| Outage ID | Unique ID number of the Panopta incident. |
| Raw Request | JSON representation of the request that can be parsed separately to get additional context on outputs. |