User and Group Performance reports
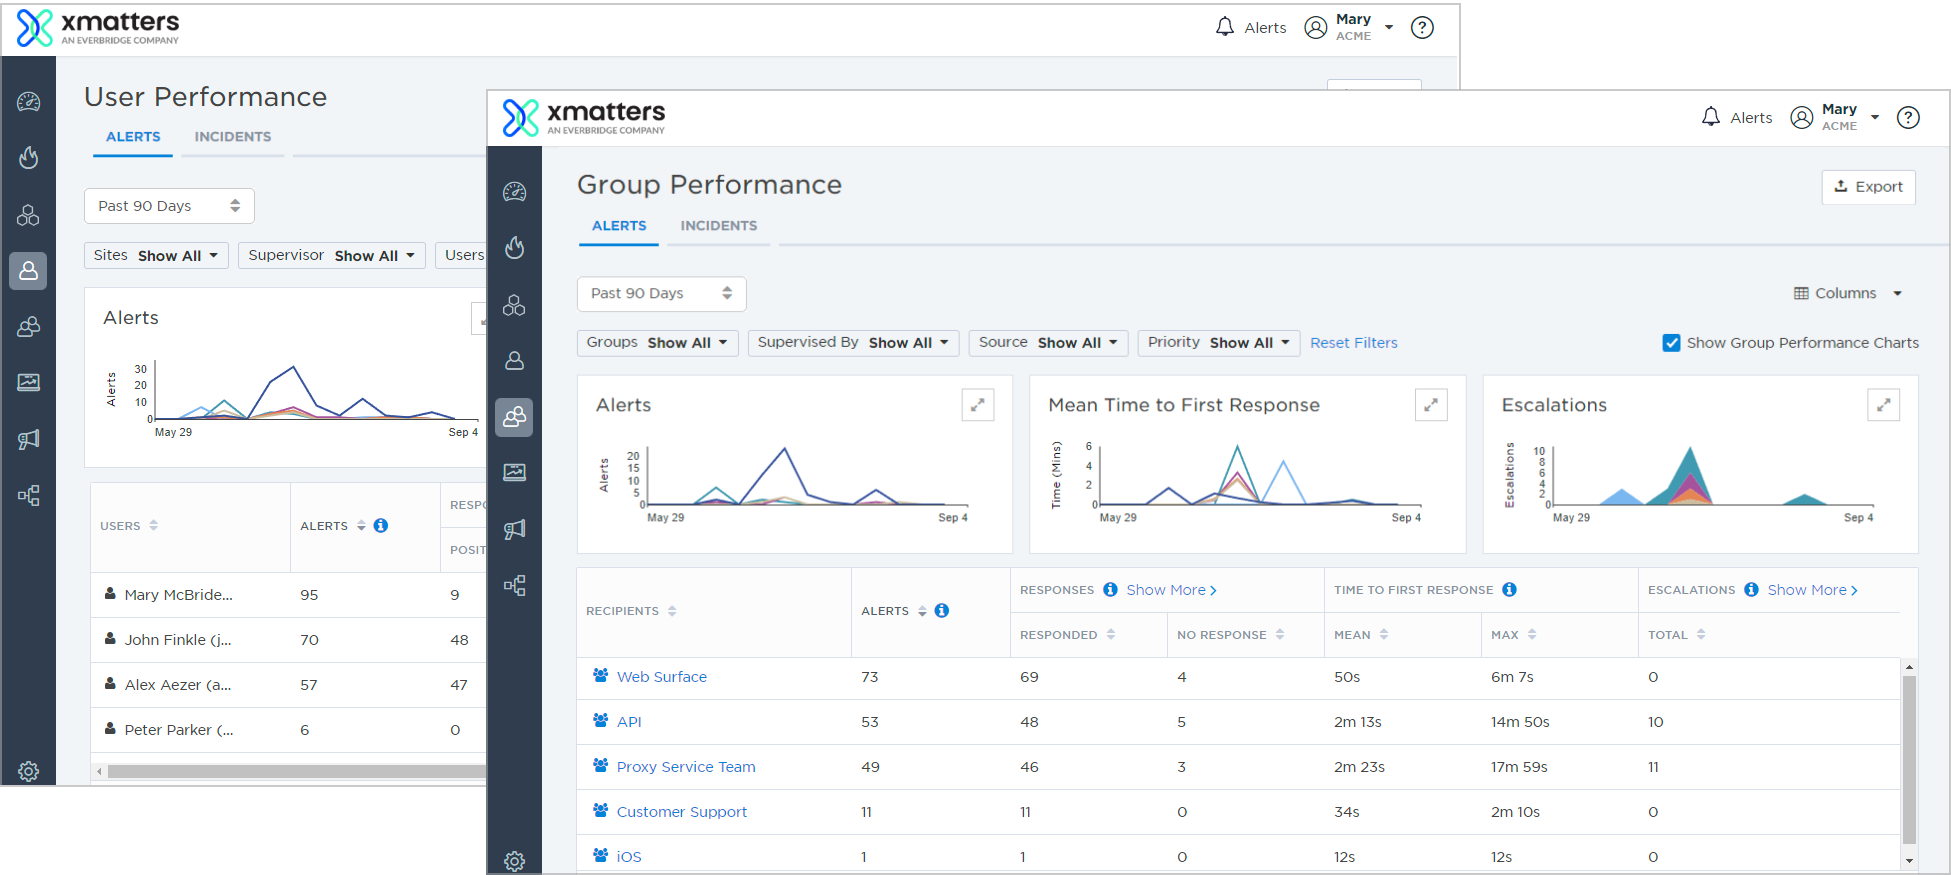
The User and Group Performance reports allow users and supervisors (and company administrators) to review trends and changes in the way people in their organization handle notifications and escalations for alerts and incidents. You can use these reports to review and analyze performance over a period of time and identify potential opportunities for operational improvements.
Some things to remember about the reports:
- The performance reports do not include notifications or responses related to subscriptions.
- The reports are updated only after alerts have been terminated and incidents have been resolved; xMatters calculates the Time-To-Response fields and the number of positive/negative responses according to the last response received.
- The Group Performance report cannot be calculated for groups with more than 1000 members, or for groups with more than four levels of nesting.
- For performance reports to work, an administrator must define how each response choice contributes towards evaluating performance, and define at least one "Positive" response contribution value. For more information, see Configure response contribution values.
- Depending on which report you want to access, do one of the following:
- On the Users menu, under Users, click User Performance.
- On the Groups menu, under Manage Groups, click Group Performance.
- To select the type of data you want to view, click the Alerts or Incidents tab at the top of the report.
Depending on which report you're viewing, select or clear the Show User Performance Charts or Show Group Performance Charts check box to display or hide the charts at the top of the report.
The User and Group Performance reports include the following charts for summarizing alert and incident performance trends:
Alert Performance Charts
|
Chart |
Description |
|
Alerts |
The number of alerts that targeted the user or group over the selected time period. |
|
Mean Time to First Response |
The mean time it takes from when a user or group was notified to when the first response was received. |
|
Escalations |
The number of alerts where there was one or more escalations within the group or included the user. |
Incident Performance Charts
|
Chart |
Description |
|
Incidents |
The number of incidents the user or group engaged in over the selected time period. |
|
Mean Time to Resolve |
The mean time it takes from when an incident was initiated to when it was resolved. |
|
Mean Time to Acknowledge |
The mean time from when a resolver was notified to when they became engaged in xMatters. |
To use the performance charts, do one or more of the following:
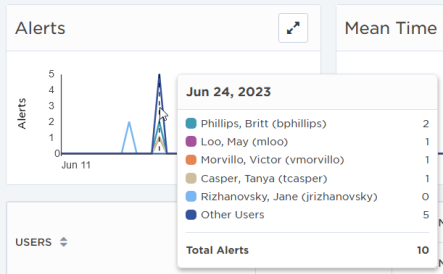
- Move your pointer over a graph to view a summary of data at a specific point in time.
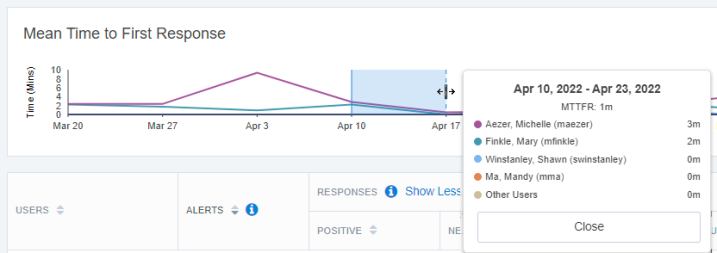
- Click and drag your pointer over the graph to highlight and summarize data for a specific time period. To adjust the selected area, move your pointer over the right or left border so that drag handles appear, then click and drag the border to a new position.
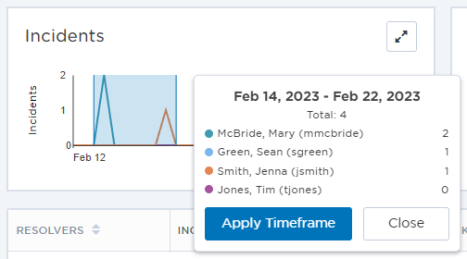
- After selecting an area on the graph, click Apply Timeframe to update the date range of the report to that selected in the graph.
- Click the Expand icon in the top right corner of a graph to view the graph in full screen mode and click the Collapse icon to return to the report.
- On the expanded chart, do one or more of the following:
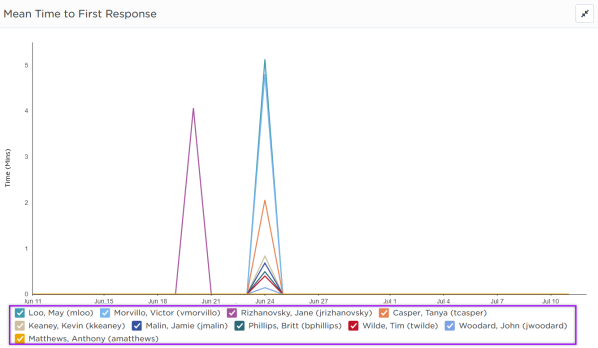
- Choose what to display on the graph by selecting or clearing the check boxes below the graph. The scale of the left axis automatically adjusts as you add or remove data from the graph.
- Double-click a check box below the graph to display data for that selection and clear check boxes for other options.
To more easily view data in the report, do one or more of the following:
- To sort the content of a column in alphabetical, numerical, or chronological order, click the column header. (Click the header again to reverse the sort order.)
- To change the width of a column, move the pointer over the edge of the column and when the re-size icon appears, click and drag the column to the desired size.
- To rearrange the columns, click and drag a column header to a new location on the table.
- Click Show More or Show Less to see supporting data for certain columns (such as Responses and Escalations).

- If the list contains more entries or columns than can be displayed on your screen, scroll horizontally or vertically. The system automatically loads more data as you scroll the page.
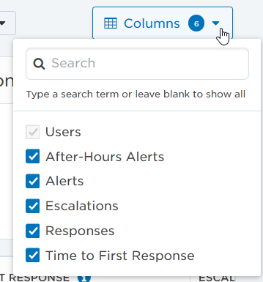
- To include or exclude columns, click the Columns drop-down menu and select or clear the columns that are included. When you've hidden a column and want to see it again, it is added as the last column of the table.
The User and Group Performance reports include the following columns for reporting data on alert and incident performance:
Alert performance columns
| Column | Description | |
|---|---|---|
| Recipient |
The name of a recipient; one of User or Group.
|
|
| Alerts |
Number of alerts in the selected time period targeting this recipient.
|
|
| Responses | Total |
Number of responses per recipient, categorized as follows:
The response tracking contribution value does not affect this count. |
| Positive | If the recipient is a user, the number of alerts in which the last response had a positive contribution value. If the recipient is a group, the number of alerts in which at least one response had a positive contribution value. | |
| Negative | If the recipient is a user, the number of alerts in which the last response had a negative contribution value. If the recipient is a group, the number of alerts in which no response had a positive contribution value. | |
| Neutral | If the recipient is a user, the number of alerts in which the last response had a neutral contribution value. If the recipient is a group, the number of alerts in which no response had a negative or positive contribution value. Note that unrecognized responses should be interpreted as neutral. | |
| Undefined | If the recipient is a user, the number of alerts in which the last response had no contribution value. If the recipient is a group, the number of alerts in which no response had no contribution value. (This value does not have the same meaning as a 'Neutral' contribution value.) | |
| No Response | The number of alerts that did not receive a response from the recipient. | |
| Time to First Response | Mean |
Mean Time to First Response, categorized as follows:
Alerts for which there is no response from the recipient do not contribute to mean Time to First Response. The times displayed in the Time to First Response columns include any delay settings specified within a team. |
| Max |
Maximum First Time to First Response; similar to Mean Time to First Response, but representing the maximum first time to respond, rather than the mean. This is calculated as the time between when the first recipient was scheduled to respond, and the time the response was first received by xMatters (including any delays specified within a group). |
|
| Escalations | To Peer |
One of the following:
For more information about how escalations are counted, see Calculate escalations. |
| To Management | Similar to escalations to peer, but counts the number of alerts for which there was an escalation to management instead of peer. For more information about how escalations are counted, see Calculate escalations. | |
| Undefined | The number of alerts for which there was an escalation with no set reporting category. For more information about how escalations are counted, see Calculate escalations. | |
|
After-Hours Alerts (User Performance only) |
The number of alerts the user received between 7 PM and 7 AM on weekdays, and any time on Saturday and Sunday. |
Incident performance columns
|
Column |
Description |
|
Resolvers |
The name of a resolver; one of User or Group.
|
|
Incidents |
Number of incidents in the selected time period where the resolver was engaged. |
|
Mean Time to Acknowledge |
Mean Time to Acknowledge, categorized as follows:
Incidents for which there is no response from the recipient do not contribute to mean Time to Acknowledge. |
| Mean Time to Resolve |
The mean time across the counted incidents between the time the incident resolution process began and the time it was resolved. |
| Engaged Duration | The total amount of time the resolver was engaged in the counted incidents. This includes whether the resolver was dismissed and then reengaged. |
The report displays data for a specific timeframe. You can select particular timeframes (Past 24 hours, Past 7 Days, Past 30 Days, Past 60 Days, Past 90 days, or Past Year), or specify a date range using the calendar and time pickers and click Apply. The results in the report and charts update to match your timeframe or date range.

If you apply filters, the report automatically updates the results to display only the data that match your filter criteria within the date range.
The available filters allow you to narrow the list of users or groups in the report based on matching specific criteria. For example, you can use filters to show the users you supervise in Denver that responded to high priority alerts, or the groups supervised by John Smith involved in high priority incidents impacting the API service.
You can apply one or more filters to narrow down the list. If you apply multiple filters, xMatters only returns entries that match all of the specified filter criteria. For detailed instructions on how to use filters, see Filtering data tables.
The following table describes the available filters and their values:
| Filter | Values |
|---|---|
| Users (User Performance only) |
|
| Groups (Group Performance only) |
|
| Supervisor/ Supervised By |
|
| Site (User Performance Only) |
|
| Source |
|
| Priority
(Alerts only) |
|
| Severity (Incidents only) |
|
| Impacted Services (Incidents only) |
|
To view the details about the underlying alerts or incidents of the filtered report, do one of the following:
- On the Alerts tab, click the number of alerts in the Alerts column to drill through to a filtered version of the Alerts report to view details about specific underlying alerts.
- On the Incidents tab, click the number of incidents in the Incidents column to drill through to a filtered version of the Incidents list to view details about specific underlying incidents.
To view details about the underlying members of a group:
- Click the name of a group to display a performance report for the members of that group. (The resulting performance report will only display the alerts that recipient received as a member of that group, and not all of the alerts sent to that recipient.)
Click Export to create a spreadsheet of the currently displayed report information.
The following examples illustrate how different escalations are calculated for the User and Group Performance reports. The figures show the performance reports for the same group and its members, with descriptions of how to interpret the information.
The terms "Peer" and "Management" do not apply to specific roles or have any direct bearing on how users function within xMatters; they are provided merely as a way to identify different levels of escalation, and can assume any definition your organization chooses.
If an escalation involves inactive members, the performance report reflects the highest level of escalation defined before or after the inactive member. For example, if a "Management" escalation occurs before an inactive member, and the escalation after the inactive member is "Peer", the performance report treats the escalation as a "Management" type.
The following figures illustrate the membership of two sample groups, Group 1 and Group 2:
Group 1:

Group 2:

The following is an example of the Group Performance report for Group 1:

By examining the report, you can determine the following:
- The Alerts column indicates that the group was targeted to receive notifications for four alerts.
- The Responses > Responded column indicates how many times at least one recipient in the group responded to each alert counted in the Alerts column. In this case, at least one member within the group hierarchy responded to each of the four alerts.
- If we click to Show More of the Responses column, we see three of the four alerts had positive responses and there was one negative response.

- The Time To First Response > Mean and Time to First Response > Max columns indicate that the mean time it took the group members to respond to each alert was around four minutes, with the longest time taking around 30 minutes. Both of these columns include the delays set within the group.
- The Escalations column indicates that a total of five escalations occurred somewhere in the group hierarchy.
- If we click to Show More of the Escalations column, we see three alerts had at least one escalation to peers, and two alerts had at least one escalation to managers.

Clicking the Group 1 link displays the following breakdown of the group's members:

By examining this report, you can determine the following information:
- The Recipients column indicates that four members of the group were targeted with notifications; group members that were not targeted do not appear in the report. Of those four members, one was a group and three were users.
- The first user listed, Member 1, received four notifications, but responded to only two, resulting in three escalations to peers.
- The Alerts column indicates that the first recipient listed, Group 2, was targeted by two alerts, one of which was escalated somewhere within the group's hierarchy to peer. The other alert was escalated to management.
Clicking the Group 2 link displays the following breakdown of Group 2's members:

By examining this report, and comparing it to the team members illustrated in the examples at the beginning of this section, you can determine the following:
- Two of the four alerts that targeted Group 1 escalated past the first three users in the team and targeted the members of Group 2 for notification.
- The first user listed, Member 4, was targeted by two alerts and responded to one of them.
- The remaining alert was escalated through both peer and management levels, and was eventually responded to by the final user listed, Member 6.