Manage the Incidents list
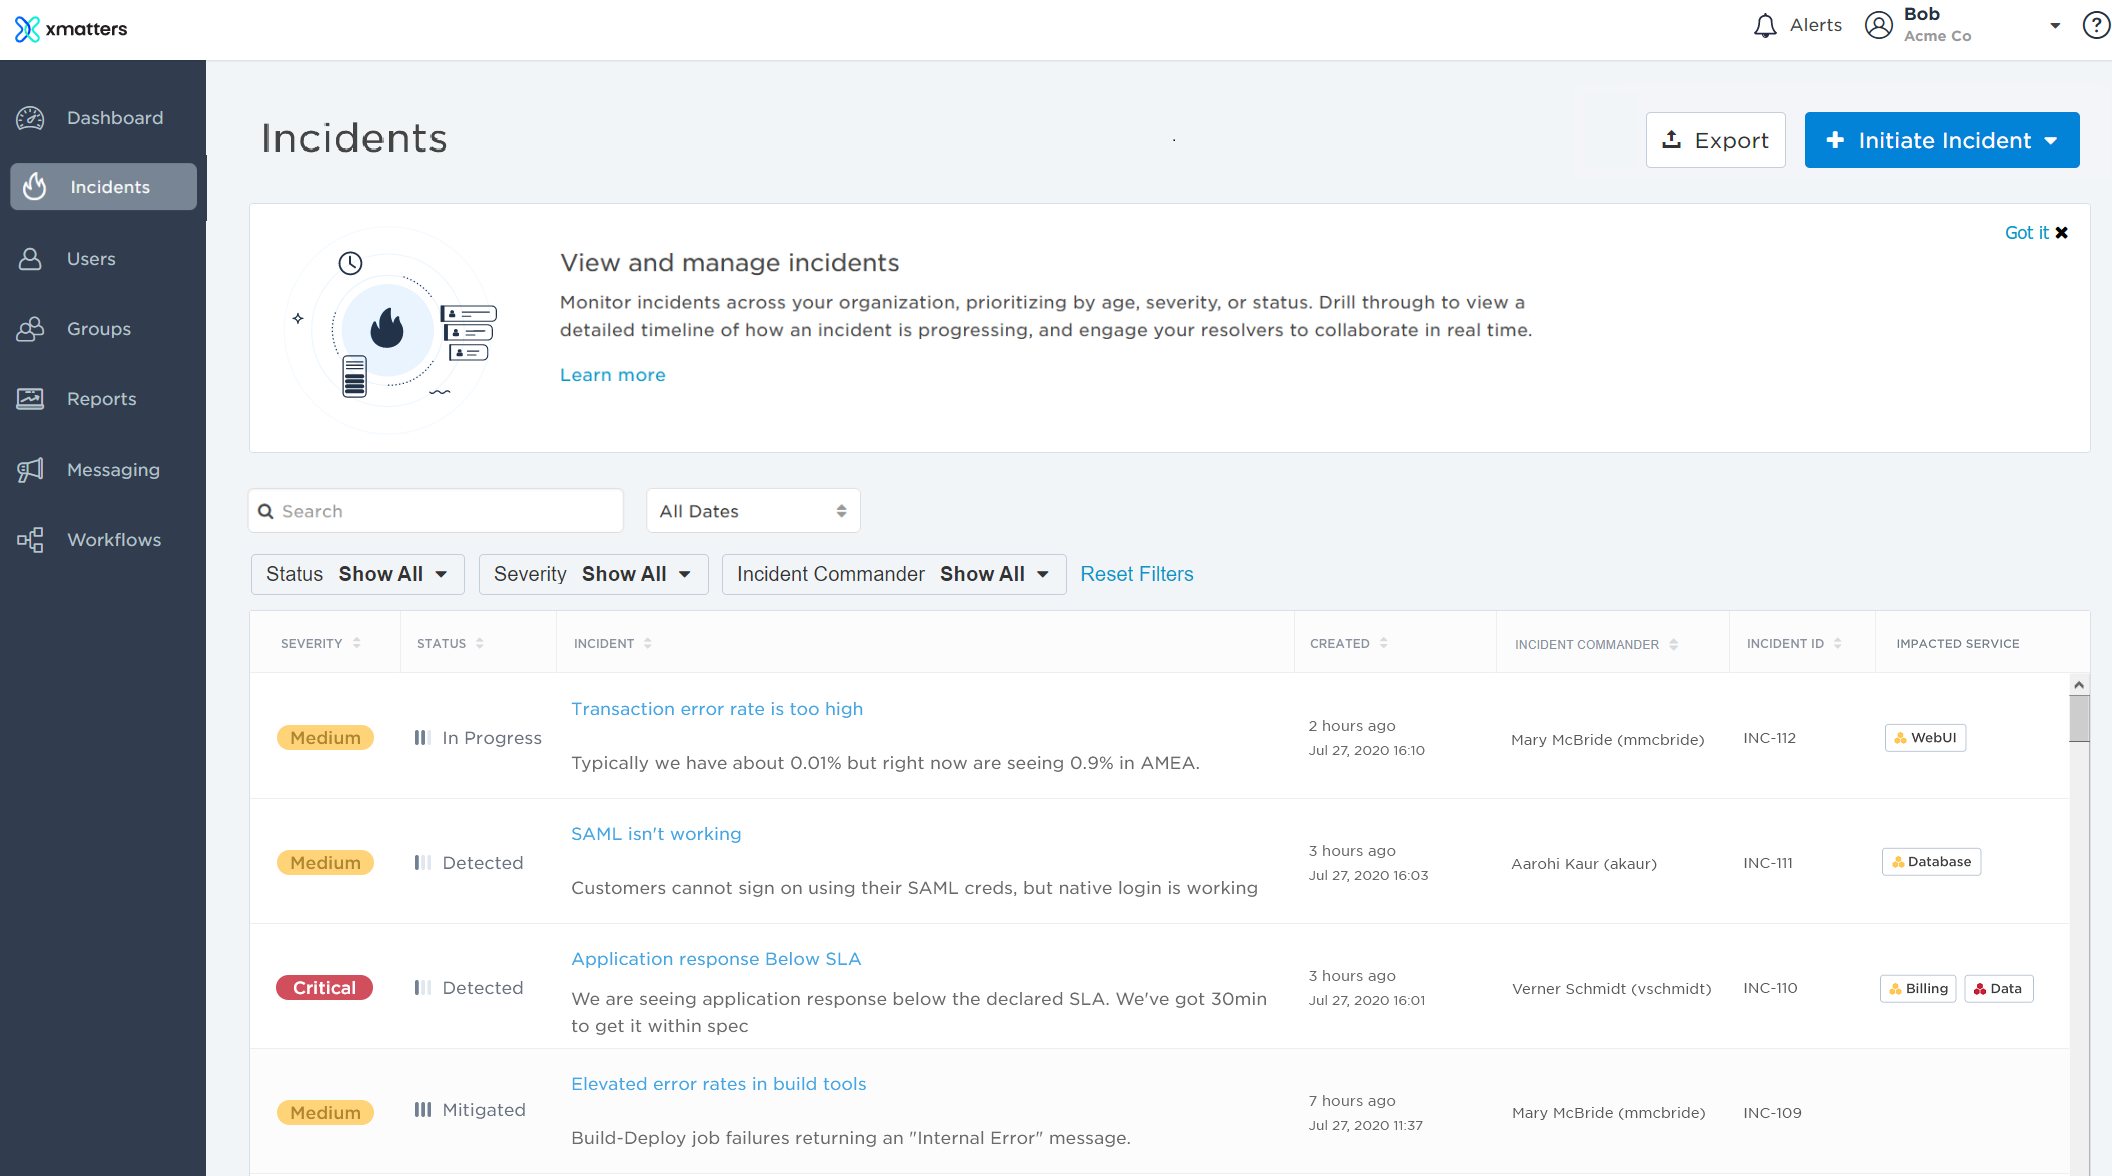
The Incidents page displays a list of all the incidents in your system that you have permission to view. You can use this screen to monitor the incidents across your organization, prioritizing which incidents require your attention based on their age, severity, status, or impacted services. If you experience a flood of incidents, you can also quickly reject the duplicate incidents by doing a bulk update of their status.
From this page, you can drill through to view a detailed timeline of how an incident is progressing, to engage resolvers to collaborate in real time, and to update the incident's details. For resolved incidents, Advanced plan customers can clearly see at a glance the status of any Post-Incident reports that have been created. Clicking the status links you to the report screen, so you can quickly review the information, make edits, or export it.

The following sections describe the actions you can perform on the Incidents page:
In the side navigation menu, click Incidents.
If you don't have permission to access and manage incidents in xMatters, the Incidents option does not appear in the navigation menu.
The Incidents list includes the incidents you have permission to view.
To more easily view data in the list, do one or more of the following:
- To sort the content of a column in alphabetical or chronological order, click the column header. (Click the header again to reverse the sort order.)
- To change the width of a column, move the pointer over the edge of the column and when the re-size icon appears, click and drag the column to the desired size.
- To rearrange the columns, click and drag a column header to a new location on the table.
- If the list contains more entries or columns than can be displayed on your screen, scroll horizontally or vertically. The system automatically loads more data as you scroll down the page.
- To include or exclude columns, click the Columns drop-down menu and select or clear the columns that are included. When you've hidden a column and want to see it again, it is added as the last column of the table.
The Incidents list includes the following columns:
| Column | Description |
|---|---|
| Severity | The severity assigned to the incident. Values include: Minimal, Low, Medium, High, and Critical. |
|
Status |
The status assigned to the incident. Values include: Detected, In Progress, Mitigated, Resolved, and Rejected. |
| Incident | The incident's summary and description. |
| Created | The date and time the incident was initiated in xMatters. |
| Incident Commander | The user assigned as the Incident Commander. |
| Incident ID |
The incident's identifier in xMatters or an external system. (Incident IDs automatically assigned by xMatters are prepended with "INC-".) |
| Post-Incident Report | The status of the Post-Incident Report. If the field is blank, a report hasn't been created yet. Values include: Draft, Ready for Review, Reviewed, Closed. |
| Impacted Services |
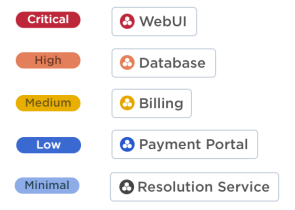
The services reported as impacted by the incident. Services are color-coded to represent the highest incident severity they're affected by, for example:
|
| Time to Acknowledge | The time from when the incident resolution process began to when a resolver became engaged in xMatters. |
| Time to Resolve |
The time from when an incident was detected, to when it was resolved.
|
| Incident Type Properties |
The value of any custom incident properties associated with an incident type. |
The Incidents list includes a date selector you can use to view incidents that occurred during a specific timeframe. By default, incidents from all dates are displayed, but you can view incidents over a variety of past time intervals or over a specific date and time period.
To view incidents by date:
- On the Incidents page, select one of the following options from the date selector:
- Past 24 Hours
- Past 30 Days
- Past 60 Days
- Past 90 Days
- All Dates
- Date Range
- If you selected Date Range, use the calendar and time pickers to select the start and end time of the date range, then click Apply.
You can use the search bar to find incidents based on their summary, description, or incident ID.
Start typing in the search bar (a minimum of two characters is required). xMatters automatically updates the list to display items that contain (partially match) the search term, and highlights the portion of each item that matches the specified criteria. If you search multiple terms, xMatters returns incidents that match all of the terms.
To clear your search, click the 'x' in the right corner of the search bar.
The available filters allow you to narrow the incidents list based on matching specific criteria. For example, you can use filters to locate open incidents with high or critical severity that impact particular services, like the 'Inventory' service in the screenshot below:

You can apply one or more filters to narrow down the list of incidents. If you apply multiple filters, xMatters only returns incidents that match all of the specified filter criteria. For detailed instructions on how to use filters, see Filtering data tables.
The following table describes the available filters on the Incidents page and their values:
| Filter | Values |
|---|---|
| Status |
|
|
Severity |
|
| Incident Commander |
|
| Impacted Service |
|
| Engaged Resolvers |
Note: For 'Resolved' incidents, results also include subgroups or service owner groups which engaged when the parent group or service was targeted. For example, if the 'API' group was targeted as a resolver and contains a 'Mobile API' subgroup, if someone from the subgroup engages as a resolver, the filter results will return both the 'API' and 'Mobile API' groups when the incident status is 'Resolved'; only the parent 'API' group is returned as a resolver for all other incident statuses (Open, In Progress, Mitigated, and Rejected). |
| Targeted Resolvers |
|
| Source |
|
| Custom Incident Properties |
|
Click an incident's summary to open it in the Incident Console.
By default, an incident can be viewed by:
- The user who initiated the incident.
- The incident commander.
- Resolvers of the incident.
- If the resolver is a group, the members and supervisors of that group. (This includes groups added as resolvers because they own an impacted service.)
- Users who have been assigned tasks for the incident.
- Company supervisors.
When a user who can view an incident has a scheduled absence, their temporary replacement can view the incident for the duration of the absence.
For detailed instructions on the different ways you can initiate an incident in xMatters, see Initiate an Incident.
The Incidents list includes controls to update the status and severity of incidents in bulk, rather than having to update each incident individually from the incident console.
This is useful when an event affecting your system or services triggers a flood of duplicate incidents. You can reject the duplicates to reduce noise, filter them from the Incidents list, and exclude them from your analytics.
To update incidents in bulk:
- On the Incidents list, use the search bar or filters to find the incidents you want to update.
- Select the check box beside an incident to select it, or use the Select All check box.
- To update the incident's status or severity, select the Update Status or Update Severity drop-down and select a new value.
- xMatters displays the Bulk Update Incident Status or Bulk Update Incident Severity dialog box, depending on which field you chose to update.
- To reject duplicate incidents, update their status to Rejected.
- Enter a note explaining the change. This justification is added to the timeline for each incident.
- Click Update.
- Once you've finished updating the incidents, close the update controls by clicking Done.
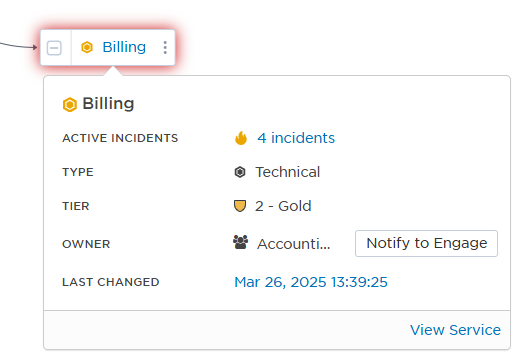
Click a service to display an info card with its name, description, active incidents, type, tier, owner, when it was last changed, and a link to view the service. If a service is undefined (not included in the Service Catalog), no additional information is included.

To view who is on call for a service:
Click the Owner group to view who is currently on call (including shifts, members, and escalations).
To view active incidents associated with a service:
The service info card includes a count of the number of active incidents currently impacting that service (incidents are considered active if their status is 'Open' or 'In Progress'). The incident icon (the flame icon) is color-coded by the highest severity of any active incidents impacting the service. In the example above, the service has 7 associated active incidents and the highest severity level of one or more of those incidents is 'Critical'. You can click the incident count to drill through to a filtered view of those incidents in the Incidents list.
Exporting incident details to an XLSX file enables you to store a copy of details about a filtered list of incidents, including information about the related incident commanders and impacted services. You can use this information to calculate the time to acknowledge and resolve incidents across a specific time period, view status and severity information, and share important incident information outside of xMatters.
To export the incident list:
- Click the Incidents tab.
- Refine the list of incidents that you want to export using the available filters.
- Click Export.
- The incidents are exported to a file named Incidents.xlsx or Incidents-Filtered.xlsx.
Any search or filter criteria you've applied are preserved when the Incidents list refreshes. You have the option to manually refresh the list or enable Auto Refresh to refresh it automatically.
The Auto Refresh option is useful if you're displaying the list on a screen, such as in a NOC, and you want to always see the most recent incidents without having to manually refresh the screen. You may find it helpful to disable the Auto Refresh option when you're scrolling through the list to look at older incidents, so you're not taken back to the top of the table each time the list automatically refreshes.
To manually refresh the Incidents list, click the Refresh button.

To enable or disable Auto Refresh, select or clear the Auto Refresh check box.

