Communication Center dashboards
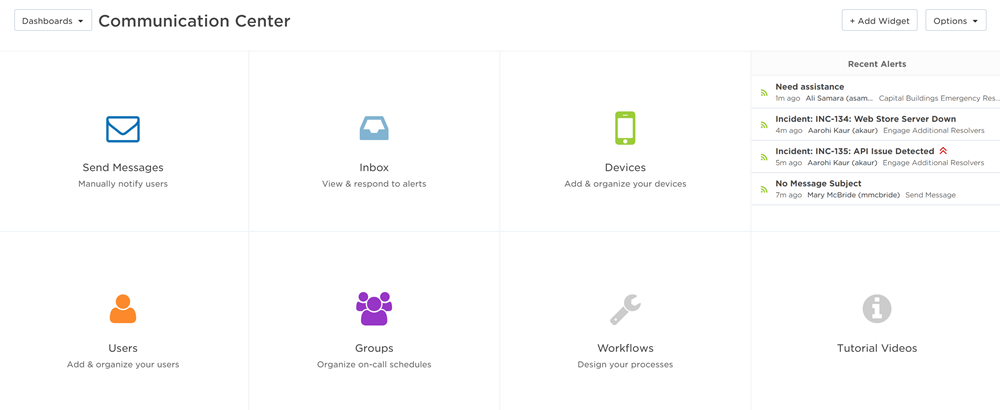
The Communication Center displays customized views of your system, allowing you to track critical processes and quickly access the tasks you perform most frequently. Each Communication Center dashboard can be customized with the available widgets, allowing you to view alerts, send messages, view your schedule, and create shortcuts to xMatters features. You could create one dashboard to show a summary of daily activity and another dashboard to monitor alerts related to a specific incident or theme.
When the Communication Center is enabled, the Home tab displays the default dashboard. You can customize this dashboard, create new dashboards, and share your dashboards with others.
Customize your dashboard with widgets
You can customize your dashboards with the available dashboard widgets. Once you add a widget to your dashboard, you can resize it to give it more room to display its content, move it to another part of the dashboard, and configure its settings.
You can easily customize your dashboard to include any of the available widgets.
To add a widget to a dashboard:
- From the communication center, click Add Widgets.
- Drag the widget to your dashboard and drop it where you want it to appear.
- A blue line or box indicates where the widget will appear.
- Click Finished.
Once you have added the widget to your dashboard, you can configure its settings. For more information about configuring widget settings, see the documentation for the specific widget.
You can adjust the location and size of dashboard widgets or delete them from your dashboard.
To adjust a dashboard widget:
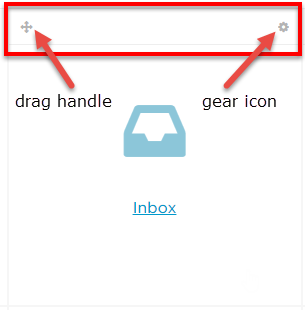
Move the pointer over the top of the widget so the drag handle and gear icon appear, and then choose one of the following options:
- To move the widget, click the drag handles and drag the widget to a new location on the dashboard.
- To delete a widget, click the gear icon and click Delete Widget.
- To resize a widget, move the pointer over the border of the widget until the resize cursor appears. You can then click and drag the border to resize the widget.
- To rename a widget that has a top border title, such as an Incident Activity widget, click the title and type a new name.
Available widgets
The widgets that are available to add to your dashboard will depend on your user permissions. For information about configuring a specific widget, refer to the help topic for that widget.
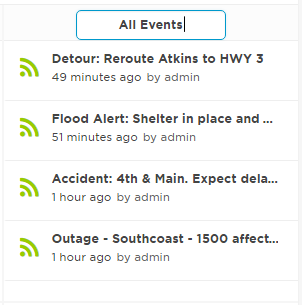
The Recent Alerts widget allows you to monitor the status of alerts in your system. By adding one or more Alerts widgets to your dashboard, you can quickly view a snapshot of the alerts that are important to you.
The Alerts widget only displays alerts from the past 30 days. For older alerts, see the Alerts report.
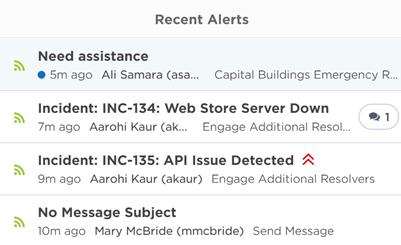
The following icons in the Recent Alerts widget on the dashboard provide additional detail to an alert:
| Icon | Description |
|---|---|

|
Indicates recent alerts within a specific timeframe (Alerts are also highlighted in blue.) |

|
Indicates Active status |

|
Indicates Suspended status |

|
Indicates Terminated status |

|
Indicates a High priority alert (Other priority levels are visible in the full alert message.) |

|
Indicates that the alert contains comments (To view comments, click the icon in the full alert message.) |
|
|
Indicates that there are alert requests which were suppressed based on your alert flood control settings (To view the suppression report, click the icon in the full alert message.) |
To view the message associated with an alert, click the alert on the widget. The full message will open on a side panel.
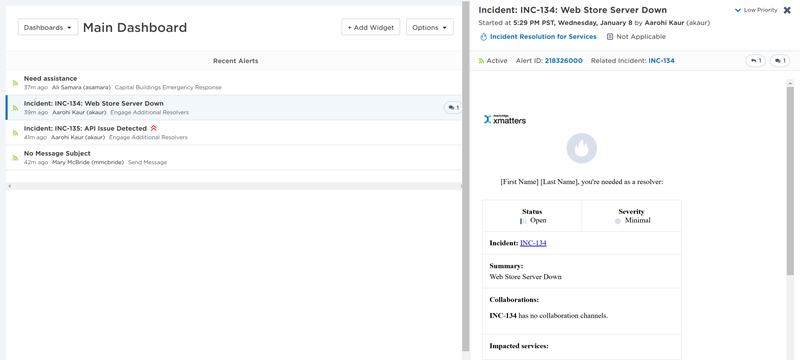
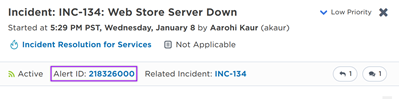
To view detailed information for an alert, click the alert ID on the full alert message.
In the full message on the side panel, click the following icons to view information about an alert's attachments, comments, conference bridge summary, fill counts, suppression report, or suppressed notifications:
| Icon | Description |
|---|---|

|
Click the paperclip icon to view attachments. |

|
Click the phone icon to view conference call information on the Conference report. |
|
|
Click the comment bubble icon to view comments. |

|
Click the response count icon to view response count information. If the icon is highlighted orange, the targeted response count for the alert hasn't been met. |
|
|
Click the stacked icon to view this alert's Suppression report for information about alert requests correlated to this alert, which were suppressed based on your alert flood control settings. |

|
Click the notification flood control icon to view the alert log for more detailed information about notifications that were suppressed for the alert. |
You can customize Alerts widgets in the following ways:
- Display alerts based on search criteria such as active alerts, all alerts, or alerts within the results of a saved alert search (e.g., alerts from a particular form, alerts initiated by a certain user, or alerts with a keyword in the message subject).
- Highlight alerts that occurred within a recent timeframe.
- Play a sound when a new alert or comment is added, or when a flood control rule is triggered to suppress alerts.
To display alerts based on search criteria:
- Hover over the Recent Alerts widget to view the gear icon and drag handles on the widget header.
- Click the gear icon, and then click Edit Settings.
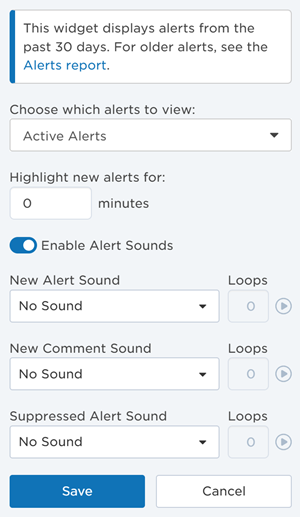
- In the Choose which alerts to view drop-down menu, select the alerts that you want to display.
- By default, the widget displays Active Alerts within the past 30 days.
- All Alerts displays alerts from the past 30 days regardless of their status (i.e., active, suspended, or terminated).
- To display previously saved Alerts report views, select the name of the view from the drop-down menu of available options.
- For more information about creating Alerts report views, see Save and manage Alerts report views.
To highlight recent alerts:
- Hover over the Recent Alerts widget to view the gear icon and drag handles on the widget header.
- Click the gear icon, and then click Edit Settings.
- In the Highlight new alerts for field, type the number of minutes you want new alerts to be highlighted for.
- Alerts that occur in the specified time range are highlighted in the Alerts widget.
- To turn off alert highlighting, configure this setting to highlight alerts for 0 minutes.
To add sound alerts:
- Hover over the Recent Alerts widget to view the gear icon and drag handles on the widget header.
- Click the gear icon, and then click Edit Settings.
- Turn on the Enable Alert Sounds toggle to view the types of activities you can configure sounds for: New Alerts, New Comments, or Suppressed Alerts.
- For suppressed alerts, the sound is played for the parent alert when an alert flood control rule is triggered, not for each suppressed alert request.
- If you've configured sounds for more than one type of activity and they occur at the same time, only one sound is played, based on the following priority: new alerts, alert suppression, new comment. For example, if all three activities occur at the same time, only the sound for new alerts is played. Or, if alert flood control is triggered at the same time somebody comments on an alert, only the sound for suppressed alerts is played.
- Since you configure sounds separately for each Alerts widget, if you have multiple alerts widgets on your dashboard, they'll both play sounds as new activities occur in your system.
- Select a sound and specify the number of times you want the sound to loop (from 1 to 10 times). To hear what your selection sounds like, click the play icon next to the sound.
- Click Save.
To receive sound alerts, your dashboard must be open in one of your browser window's tabs.
The Alert Traffic widget allows you to monitor the volume of alerts coming into your system over time, from different sources or with different priority levels. By adding Alert Traffic widgets to your dashboard, you can create custom snapshots of the alert traffic that's taking place in your system, and have the ability to drill through to the underlying data in the Alerts report.
You can also configure the widget to graph alert data based on the alert's source (the workflow it's associated with) or the alert's priority:
- Alerts by Source: The widget displays alert counts for either the six workflows with the highest amount of alert traffic over the specified timeframe (if you have more than six workflows in your system, the sixth category is labeled "Other Sources" and combines traffic from all your additional workflows). Or, for the specific workflows selected when configured.
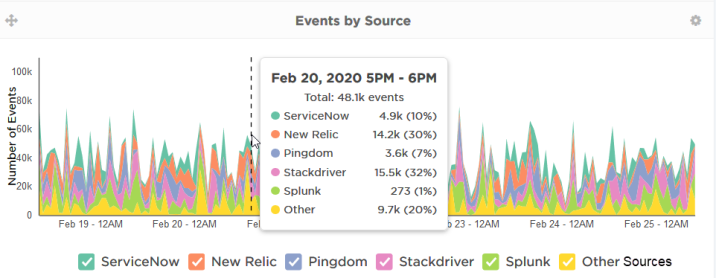
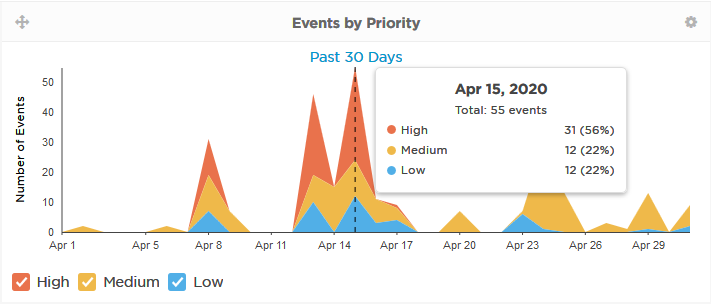
- Alerts by Priority: The widget displays the Low, Medium, and High priority alerts over the specified timeframe.
To use the Alerts Traffic widget:
- Rename the widget by clicking the title and typing a new name.
- Choose which data sources to display on the graph by selecting or clearing the check boxes below the graph. The scale of the left axis automatically adjusts as you add or remove data from the graph.
- Double-click one data source to quickly display the data for that source and clear the check boxes for the other sources.
- Move your pointer over the graph to view a summary of alert count data at a specific point in time. The averaging period of the data depends on the timeframe of the graph:
- Past 24 Hours: 15 minutes
- Past 7 Days: Hourly
- Past 30 Days and Past 60 Days: Daily
- Past 90 Days: Weekly
- Click and drag your pointer over the graph to highlight and summarize data for a specific time period. To adjust the selected area, move your pointer over the right or left border so that drag handles appear, then click and drag the border to a new position.
- Drill through to the Alerts report for a more detailed view of the data supporting the displayed graph or selected area by doing one of the following:
- Click the timeframe summary below the graph's title ('Past 30 Days' in the example above) to view data for that timeframe.
- Select an area on the graph and then click View Report in the summary pop-up window to view data for the selected period.
- Hover over the graph and click the name of the workflow in the pop-up window to drill-down into that specific workflow's data in the Alerts report.
To configure the Alert Traffic widget:
- Hover over the widget to view the gear icon and drag handles on the widget header.
- Click the gear icon, and then click Edit Settings.
- The widget displays a pop-up window.
- Click the Graph drop-down to select which type of graph to display:
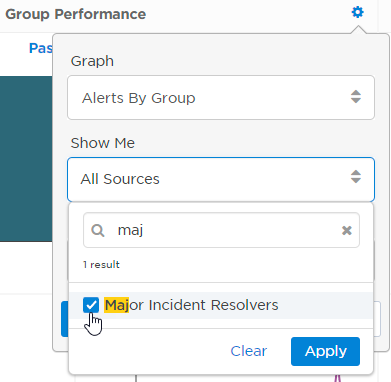
- Alerts by Source: If this graph is selected, you can choose which workflows you want to see in the widget. Click the Show Me drop-down and select either All Sources to show the six workflows with the highest amount of alert traffic over the specified timeframe, or use the search bar to find and select specific workflows.
- Alerts by Priority
- Alerts by Source: If this graph is selected, you can choose which workflows you want to see in the widget. Click the Show Me drop-down and select either All Sources to show the six workflows with the highest amount of alert traffic over the specified timeframe, or use the search bar to find and select specific workflows.
- Click the Timeframe drop-down and select one of the following:
- Past 24 Hours
- Past 7 Days
- Past 30 Days
- Past 60 Days
- Past 90 Days
- Click Save.
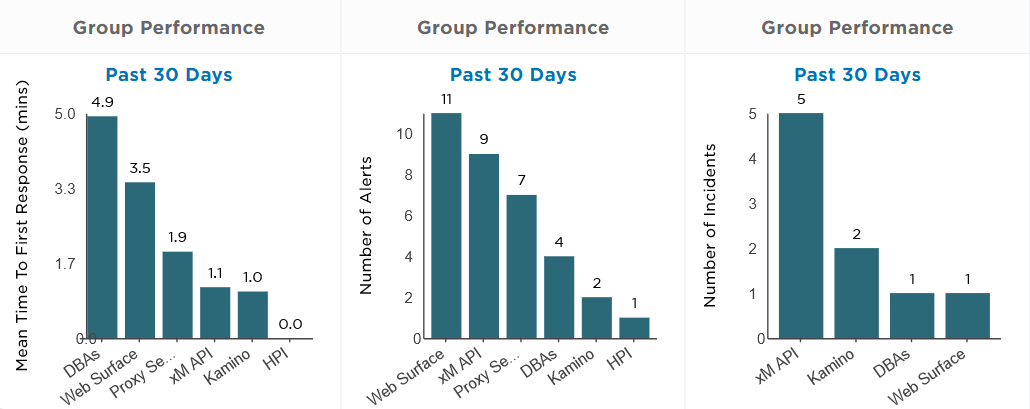
The Group Performance widget lets you track alert activity, incident activity, and response performance of the groups in your system. By adding one or more Group Performance widgets to your dashboard, you can see a visualization of the key data from the Group Performance report, allowing you to clearly identify groups that may be inundated with alerts, or users who may not be performing as expected.
For a more detailed view of the data supporting the displayed graph, you can view the Group Performance report by clicking the graph summary link below the graph's title. Or, you can view the specific underlying details of each group by clicking on the group's bar. This will display the sub-panel of the Group Performance report which corresponds to the group you clicked on and timeframe of the graph. The "Other Groups" category displays data for any remaining groups that don't fit on the graph.
You can configure the Group Performance widget to show the following data:
- Group MTTFR (Mean Time to First Response): The group's mean time to first respond to alerts in the selected timeframe.
- Alerts by Group: The number of alerts targeting the group in the selected timeframe.
- Incidents by Group: The number of incidents in which the group was engaged as a resolver in the selected timeframe.
To configure the Group Performance widget:
- Move the pointer over the widget and click the gear icon.
- Select Edit Settings, to choose which data sources to display on the graph.
- From the drop-down menus, click the Graph drop-down to select which type of graph to display:
- Group MTTFR
- Alerts by Group
- Incident MTTA & MTTR by Group
- Incidents by Group
- Click the Show Me drop-down and select either Groups I Supervise to show only groups that have the logged in user as the supervisor, or use the search bar to find and select specific groups.
- Click Timeframe and select the graph timeframe:
- Past 24 Hours
- Past 7 Days
- Past 30 Days
- Past 60 Days
- Past 90 Days
- Past Year
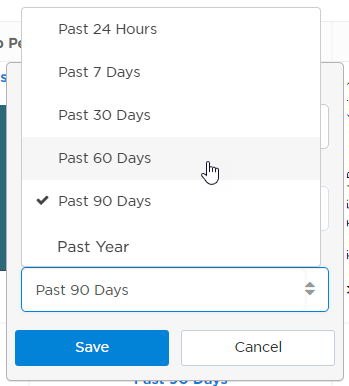
- Click Save.
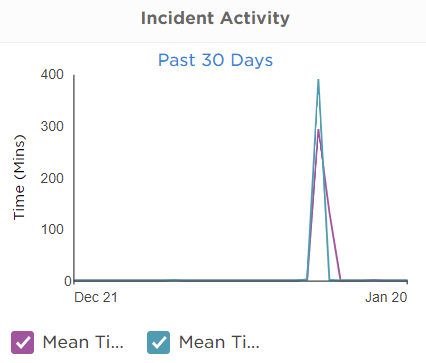
The Incident Activity widget displays important incident data (such as the number of incidents with particular severity levels, impacted services, or mean time to acknowledge and resolve over a specified time period). This allows you to visualize trends in the volume and severity of incidents, the services impacted, and the efficiency of your incident response process, making it easier to identify possible issues or improvements. You can drill-through to a filtered version of the Incidents list to view details about specific underlying incidents.
You can configure the widget to show data based on incident severity levels, impacted services, or MTTA & MTTR:
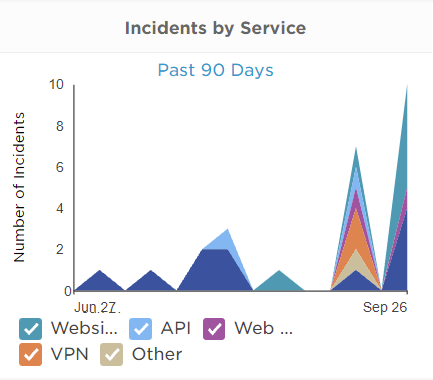
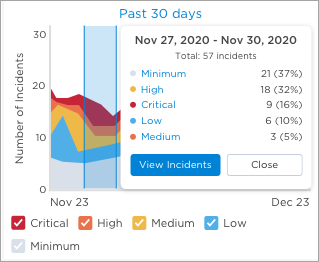
- Incidents by Service: The widget displays the number of incidents for either the six services with the highest number of incidents over the specified timeframe (if you have more than 6 services in your system, the sixth category is labeled 'Other' and combines activity from all your additional services), or for the specific services selected when configured.
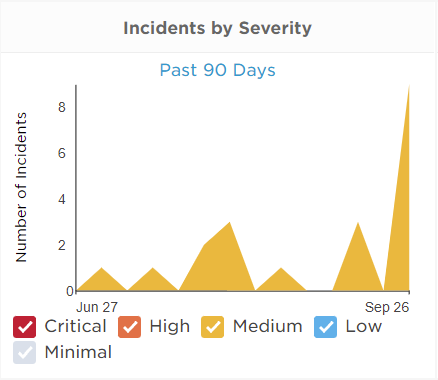
- Incidents by Severity: The widget displays the number of incidents that occurred with particular severity levels over a period of time.
- Incident MTTA & MTTR: The widget displays the Mean Time to Acknowledge (MTTA) and Mean Time to Resolve (MTTR) of incidents with particular severity levels over a period of time.
To use the Incident Activity widget:
- Rename the widget by clicking the title and typing a new name.
- Choose what to display on the graph by selecting or clearing the check boxes below the graph. The scale of the left axis automatically adjusts as you add or remove data from the graph.
- Double-click a check box below the graph to display incident data for that selection and clear check boxes for other options.
- Move your pointer over the graph to view a summary of incident data at a specific point in time. The averaging period of the data depends on the timeframe of the graph:
- Past 24 Hours: 15 minutes
- Past 7 Days: Hourly
- Past 30 Days and Past 60 Days: Daily
- Past 90 Days: Weekly
- Click and drag your pointer over the graph to highlight and summarize data for a specific time period. To adjust the selected area, move your pointer over the right or left border so that drag handles appear, then click and drag the border to a new position.
You can drill-through to the Incidents list to see the incidents that support the displayed graph or selected area by doing one of the following:
- Click the timeframe summary below the graph's title ('Past 30 Days' in the example above) to view the incidents in that timeframe.
- Select an area on the graph and then click View Incidents in the summary pop-up window to view the related incidents for the selected period.
- Hover over the graph and click a severity level or service in the pop-up window to see the incidents that occurred with a specific severity or that impacted a specific service.
To configure the Incident Activity widget
- Move the pointer over the widget and click the gear icon.
- Click Edit Settings.
- Click the Graph drop-down to select which type of graph to display:
- Incidents by Service: If this graph is selected, you can choose which services you want to see in the widget. Click the Show Me drop-down and select either All Services to show the six services with the highest number of incidents over the specified timeframe, or use the search bar to find and select specific services.
- Incidents by Severity
- Incident MTTA & MTTR: If this graph is selected, you can choose which incident severity levels you want to see in the widget. Click the Severity drop-down and select the severity levels you want to see, or click Clear to show all severity levels.
- Incidents by Service: If this graph is selected, you can choose which services you want to see in the widget. Click the Show Me drop-down and select either All Services to show the six services with the highest number of incidents over the specified timeframe, or use the search bar to find and select specific services.
- Click the Timeframe drop-down and select one of the following:
- Past 24 Hours
- Past 7 Days
- Past 30 Days
- Past 60 Days
- Past 90 Days
- Click Save.
This is part of the adaptive incident management toolset and is not yet available in all instances.
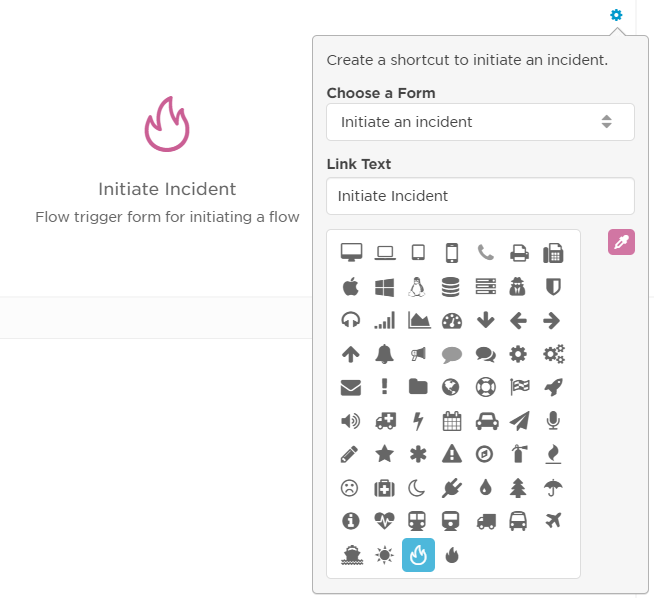
When an incident occurs, the Initiate Incident widget allows you to quickly trigger a flow to create a new incident, straight from your dashboard. Use this widget to create a trigger shortcut by choosing a form, link text, and widget icon.
To configure the Initiate Incident widget:
- Move the pointer over the widget and click the gear icon.
- Click Edit Settings.
- Choose a form from the drop-down menu for the flow where you want to trigger the incident.
- In the Link Text field, type the name you want to appear on your dashboard for this widget.
- Select an icon for the widget, and click the eyedropper to change the icon's color.
- Click anywhere on the dashboard to save your changes.
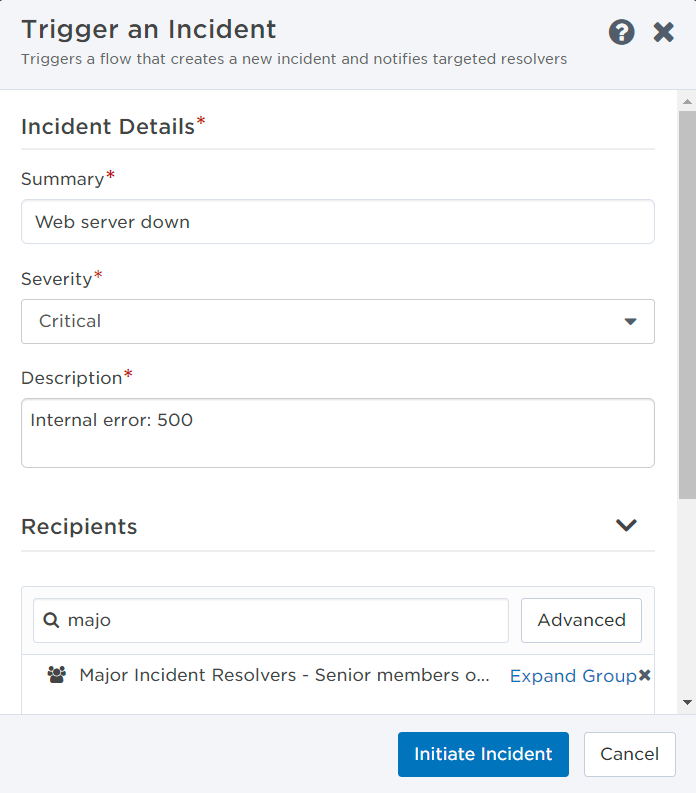
To use the Initiate Incident widget:
- Once the widget is configured, click the widget label to initiate an incident.
- Enter a Summary to summarize the most important information about the incident.
- Choose a Severity from the drop down menu.
- Add a Description to include any additional details that may be useful for resolvers.
- Add Resolvers by typing a name in the search field, or click Advanced to search for and add multiple recipients at once.
- Click Initiate Incident to initiate the incident.
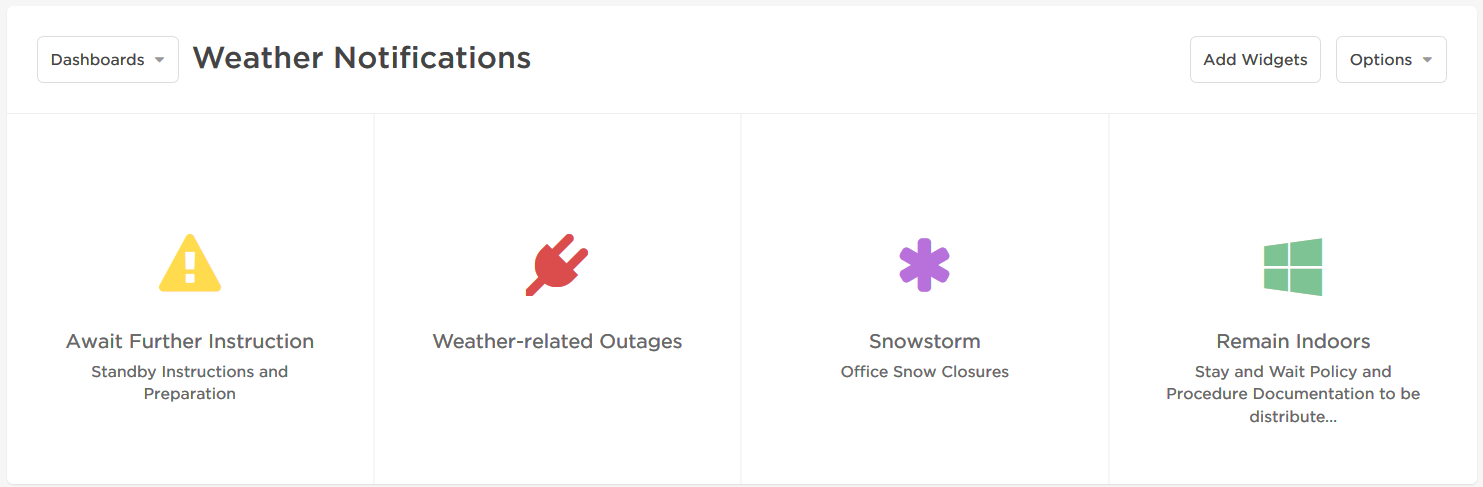
The Send Message widget allows you to create shortcuts to specific messaging forms and scenarios. You can use a set of messaging links to create a dashboard that allows you to quickly send messages related to a specific alert such as a major IT outage or severe weather alert.
To configure the Send Message widget:
- Move the pointer over the Send Message widget.
- The gear icon and drag handles appear.
- Click the gear icon, and then click Edit Settings.
- The MSend Message widget displays a pop-up window.
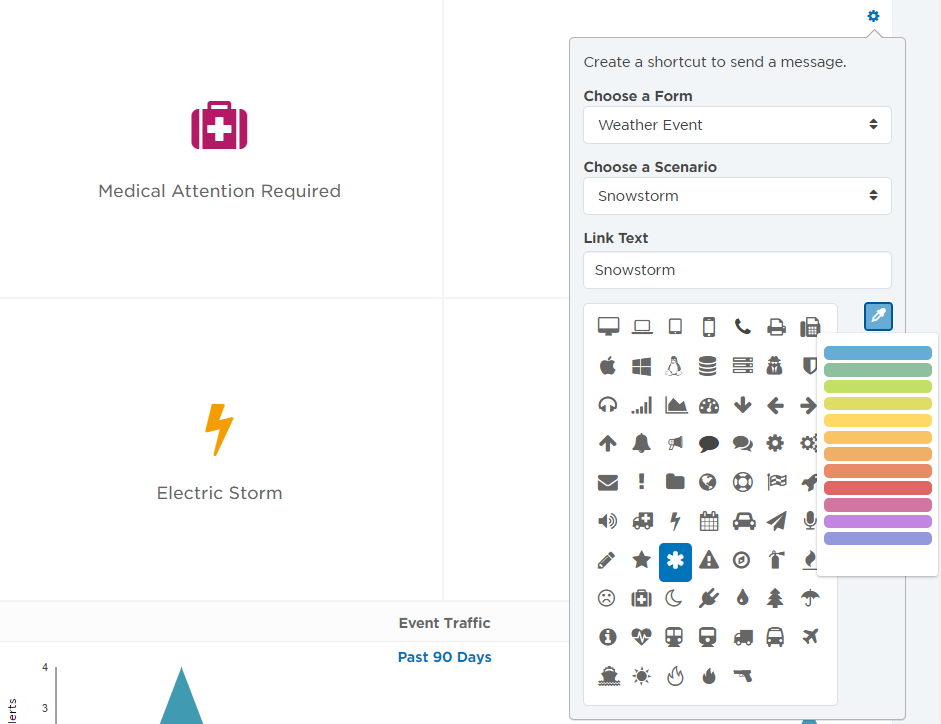
- Click the Choose a Form list box and select a form.
- Click the Choose a Scenario list box and select a scenario, if available.
- In the Link Text field, type the text to display as the label for your messaging link.
- The description text that appears below the widget label is automatically populated using the form's description. To add or edit a widget's description, edit the description field for the form in the workflow builder.
- Select an Icon from the available selection. Click the color picker icon to select a color for the icon, as shown below.
The Quick Link widget displays a link to part of the xMatters interface. You can view quick link widgets for the parts of xMatters that you are able to access according to your roles and permissions.
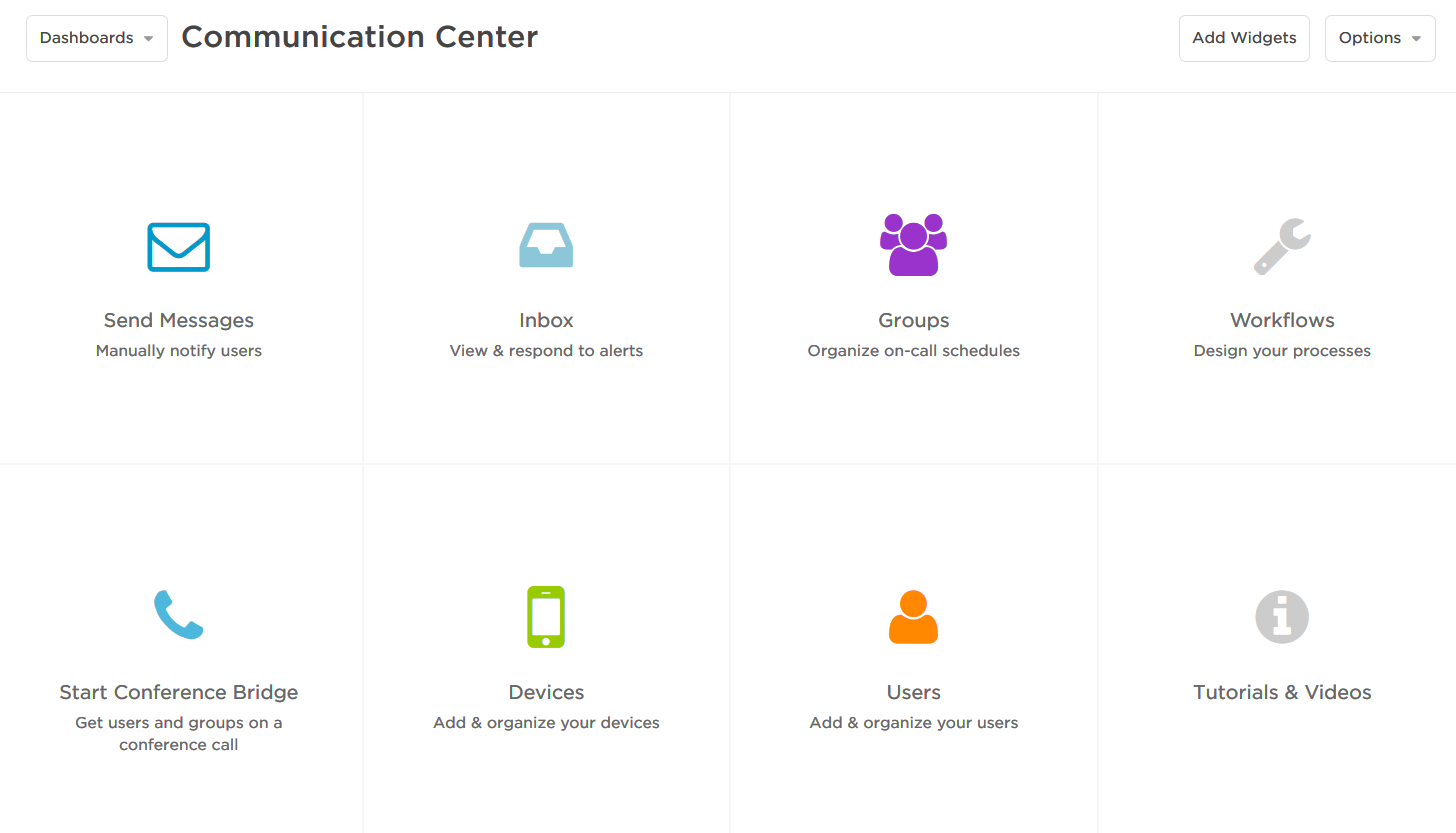
Available quick links
- Inbox
- Devices
- Groups
- Workflows
- Subscriptions
- Users
- Send Messages
- Tutorial Videos
To configure a Quick Link widget:
- Access Choose a Link by doing one of the following:
- If the widget has not already been configured, click Edit Settings, and then click Choose a Link.
- If the widget has already been configured, move the pointer over the widget, click the gear icon, and then click Choose a Link.
- Click the drop-down list, and then click the type of link to display.
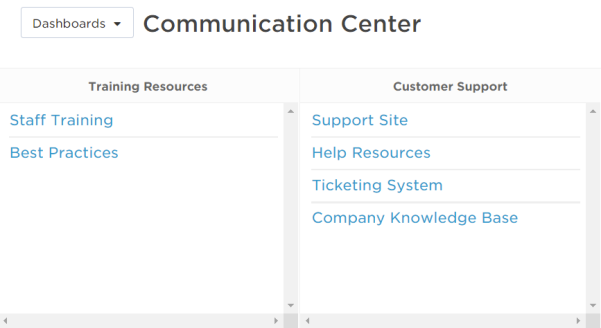
The Custom Links widget allows you to add a curated list of up to 10 web links to the xMatters dashboard. You can add multiple Custom Links widgets to your dashboard if you want to group links by type (for example, one widget for 'Training Resources' and another for 'Customer Support'), or if you need to add more than 10 links.
To configure the Custom Links widget:
- Move the pointer over the widget.
- The gear icon and drag handles appear.
- Click the gear icon, and then click Edit Links.
- Type the Link Text (this is what's displayed in the widget).
- Add the URL you want the text to link to.
- If you want to add additional links, click Add Another Link. (You add up to 10 links to each widget.)
- Click Add to update the widget.
The My Schedule widget allows you to monitor your current on-call status. By adding the My Schedule widget to your dashboard, you can quickly view how long you are on call for or when you will be on call next. The My Schedule widget is a shortcut to the schedule tab of the user profile. You can configure the widget to filter your schedule based on your position in the shift escalation order.
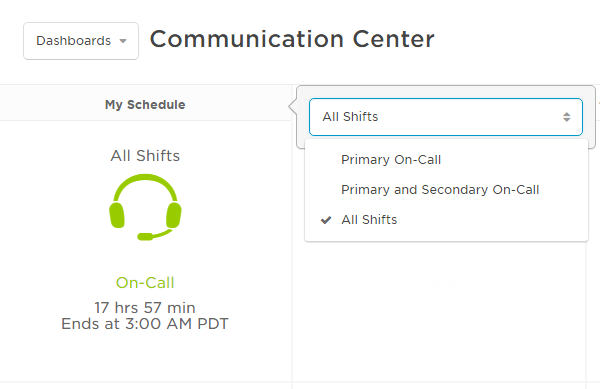
To configure the My Schedule widget:
- Move the pointer over the My Schedule widget. The gear icon and drag handles appear.
- Click the gear icon, and then click Choose a filter. The My Schedule widget displays a menu.
- Click the list box, and select a schedule filter: Primary On-Call, Primary and Secondary On-All, or All Shifts.
- You can configure more than one My Schedule widget on your dashboard.
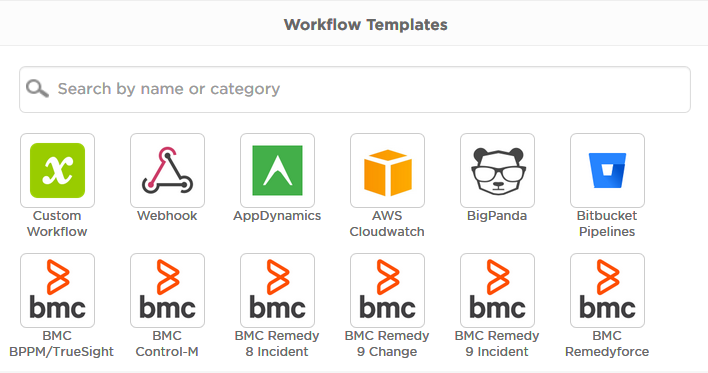
The Workflow Templates widget displays workflows between xMatters and third party applications that are available to install in your xMatters deployment.
To use the Workflow Templates widget:
- Scroll through the list of workflows or use the search function to find a specific application.
- Move the pointer over an icon to view a description of the workflow.
- Click the icon for an workflow to go to that workflow's configuration screen.
Create and view additional dashboards
Depending on your license level, you can create new dashboards, manage your dashboards, and share them with others. For more information about managing and sharing dashboards, see Manage and share dashboards.
When you log in for the first time your dashboard will reflect your role, but you can easily customize it so the information that's most important to you is always easy to see. For example, if you supervise numerous groups, you can create an additional dashboard that only shows group performance information for specific groups or timeframes. If you have various roles, or only want to see certain information at a given time, you can create and save multiple dashboards for different widgets, such as a dashboard solely to track group performance, and a separate one to monitor alert analytics in your system.
If you have the Read-Only User role, you can rearrange your dashboard but you can't save changes. The dashboard will reset to the default layout each time you log in.
You can create different dashboards that focus on different aspects of your deployment, or provide access to different reports and tools.
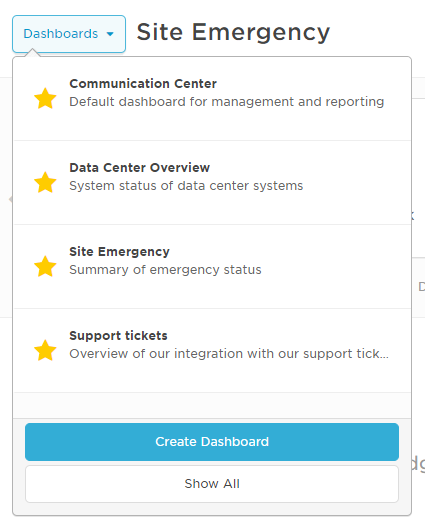
- In the navigation menu, click the Dashboards option.
- On the Communication Center page, click Dashboards, and then click Create Dashboard.
- In the Create Dashboard window, type a name and description for the dashboard, and click Create Dashboard.
- Drag widgets on to the canvas, configure their settings, and click Finished. For more information about each widget, see Customize widgets and dashboards.
To view another dashboard that you created or that someone has shared with you, click Dashboards and then select the dashboard you want to view. Scroll down this list to locate dashboards that are not displayed on the screen.