Detailed alert information
While the Alerts report provides a high-level look at every alert in your system, you can click an Alert ID to drill into the details of a specific alert or export it.
A note about data retention...
Data in the Timeline, Log, Conference, Attachments, and Suppression tabs is retained for a limited time, based on your pricing plan. Once the data expires, the tab disappears from view. You can use the Export button to save Log or Conference information. Since Timeline and Suppression information isn't included in the export, we recommend manually capturing this data if you require it. For example, copy and paste to a spreadsheet or document, print to PDF, or take a screen capture. Contact your administrator for the data retention limits specific to your company.
Alert header
The header for each alert shows alert-specific information and includes links to related incidents and the incoming signal that triggered the alert.

The header includes the following information:
| Label | Description |
|---|---|
|
Alert ID |
The unique identifier created when the alert was initiated. |
| Started at | The date and time when the alert started. |
| Initiator | The name of the integration or ID of the person who initiated the alert. |
| Related Incident | A link to the incident the alert is related to. Clicking the link takes the you to the Incident Console. |
| Priority |
The relative priority level of the alert as set by the message sender. Higher priority messages have better access to notification resources relative to lower priority messages in the system. Available priority levels are: |
| Source | The name of the workflow or integration. |
| Form | The name of the form that triggers the alert. Note: Alerts generate by a Create Alert step do not have a Form value. |
|
Duration |
The elapsed time of the alert.
|
|
Status |
The status of the alert. Status options are:
|
| Duplicate | If an alert can be duplicated, the Duplicate button appears in the header. The form is displayed with its properties set to the values of the current alert. You can adjust the values and resend it. |
| Sender Display Name | If Sender Overrides are enabled for a form, the name set by the form designer is displayed. |
If you're viewing the details of an active alert, the page periodically refreshes to provide an updated view or show any changes. This includes user delivery metrics, responses, comments, and group fill counts, along with any changes to status or other information in the header area.
Overview
The Overview tab shows you general overview information and statistics for the alert. You can expand and collapse sections on the Overview tab so that information more important to monitoring the alert is more visible at a glance.
Notification Streams
If the alert resulted in subscription notifications, you can refine the data shown on the Overview tab to only include information for notifications related to a single subscription, or to multiple subscriptions.
To filter by notification stream:
- Beside the Show results from option, click the Notification Streams drop-down menu.
- This option only appears for alerts with associated subscriptions.
- Select the check boxes next to the notification streams you want to include in the Alert report, and then click Apply.
- To exclude subscription notifications from the report, select the Targeted Recipients check box, and clear any selected subscriptions.
Click any link in this section to open the User Delivery tab and automatically apply the appropriate filters to see those notifications.
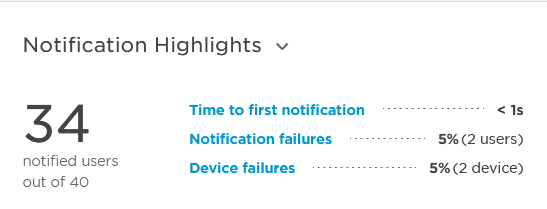
Notification Highlights
The Notification Highlights section provides you with a quick overview of the notifications for the alert. You can quickly see how many users were notified, the time to the first notification, and the percentage of notifications that failed. Click Device failures to go to the Notifications report for the alert.
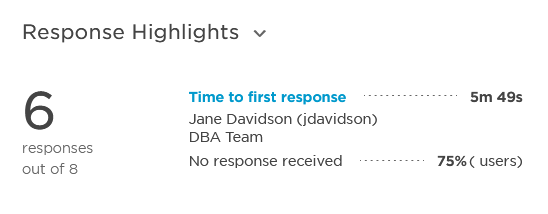
Response Highlights
The Response Highlights section contains an overview of the responses for the alert. You can quickly see how many recipients responded to the notification, the time it took the recipients to respond, and the percentage of recipients who failed to respond.
User Delivery Summary
The User Delivery Summary lets you quickly see how many users were notified of an alert; how many notifications were delivered or failed, and how many users responded to the notification.
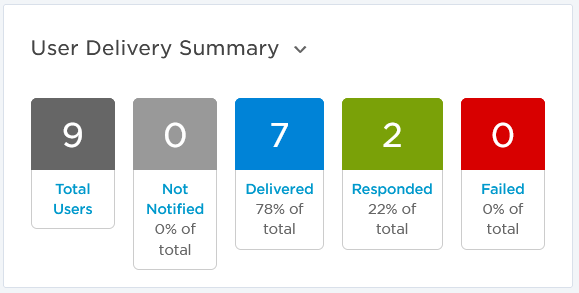
This section summarizes the status of each delivery attempt using the following terms:
- Total: The total number of targeted users
- Not Notified: Number of users who have not been notified on any device. This may be because they have not configured any notifiable devices or because the event terminated before the notification was sent. In this case, xMatters did not attempt to notify the user.
- Delivered: Number of users who had at least one notification delivered to one of their devices, but who have not yet responded.
- Responded: Number of users who have responded to a notification. Only the user's last response counts towards this number.
- Failed: Number of users did not receive a notification because delivery failed on all devices when xMatters attempted to notify them. This may be because of an incorrect device configuration, problems with the service provider, etc. In this case, the message cannot be delivered and xMatters does not attempt to deliver the notification again.
Click the blue label for any of the boxes to automatically open the User Delivery tab and apply the appropriate filter. For example, clicking the Responded label will open the User Delivery tab and show the users who responded to the alert and what their responses were.
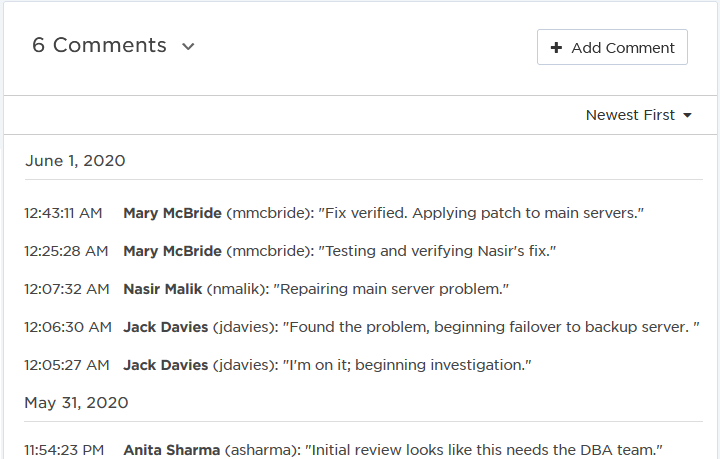
Comments
After an alert is resolved, you might want to perform a postmortem. To give you access to as much information about an alert as possible, the Comments section stores all comments added by users by date and timestamp. You can sort by newest or oldest comment first, and even add additional comments directly to the alert using the Add Comment button.
Responses
The Responses section provides you with detailed response information, such as how many users responded, and which response choice the notified users selected.
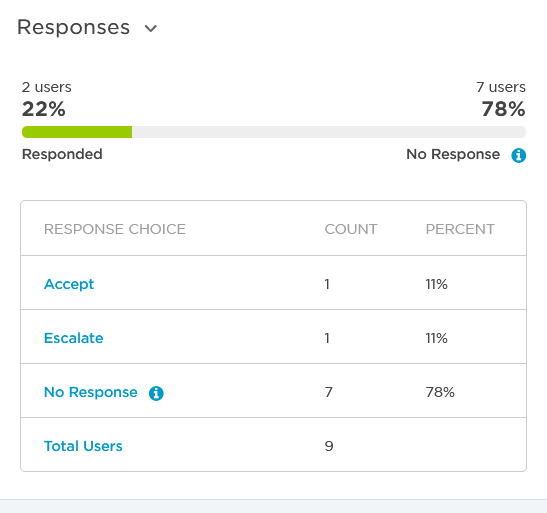
If response counts were specified for the alert, the Responses section plots the user responses for each group instead. The checkered line on each bar represents the number of responses required for that response group. Green responses (which increment from the left side of the response bar) indicate responses with the Add To Response Count action, while red responses (which increment from the right side of the response bar) indicate responses with the Do Not Add To Response Count action.
Alert Details
The Alert Details section displays basic information and properties about the alert. Some details and properties are only displayed if they were included in or relevant to the alert.
Alert Information
The Alert Information section includes information about who was targeted for notification by the alert, and the handling options used on the form or trigger to create the alert, including:
- The date and time at which the alert was scheduled to expire.
- The Request ID from the inbound integration that triggered the alert.
- A list of recipients (and, if applicable, site recipients) targeted for notification.
- The handling and override options enabled or disabled for the alert.
Devices
The Devices section lists the device types and names that were targeted for notification by the alert, as determined by the settings on the form or trigger.
Alert Properties
The Alert Properties section lists the properties and other information included in the signal that triggered the alert or, in the case of a message sent from the Messaging tab, the message content and other details.
User Delivery
The User Delivery tab provides you with detailed information on who was notified for a specific alert, if they were notified as part of a group, the delivery status, the date and time of the notification, and which devices were contacted.
For more information about using and interpreting delivery data, see User Delivery.
Message
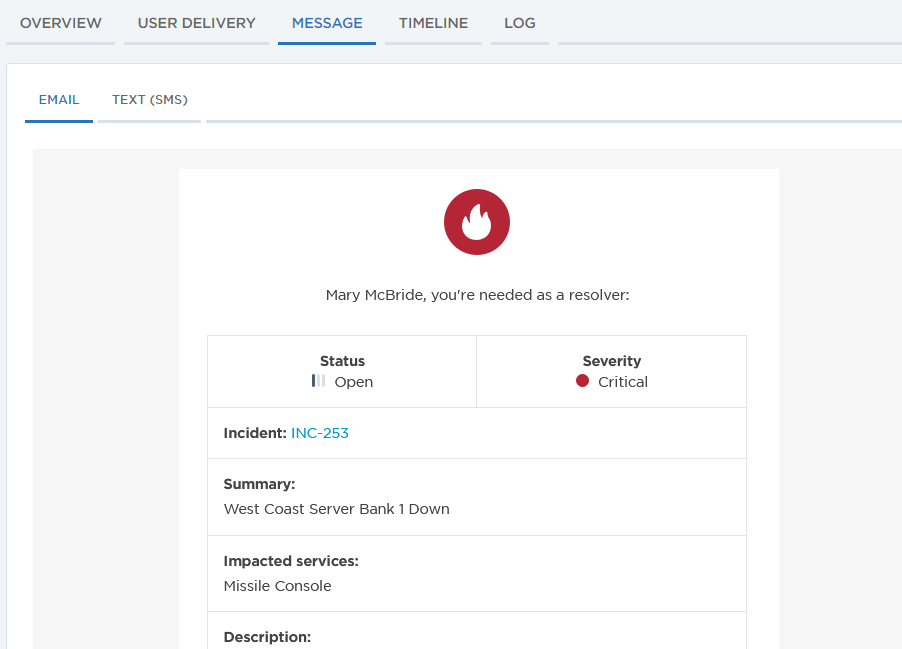
The Message tab displays the email or text (SMS) message and responses a user received when the alert was triggered.
If there was no content configured for a message type at the time of the alert, the Message tab does not display any content for that message type.
Timeline
You can use the timeline during an active alert to quickly gain insight into the way an incident is progressing and to see who is actively working to resolve the issue. You can also review the timeline after an alert has completed to make improvements to your incident management process.
The timeline depicts a chronological and visual representation of when and how recipients were notified for an alert, and includes details about how they responded.
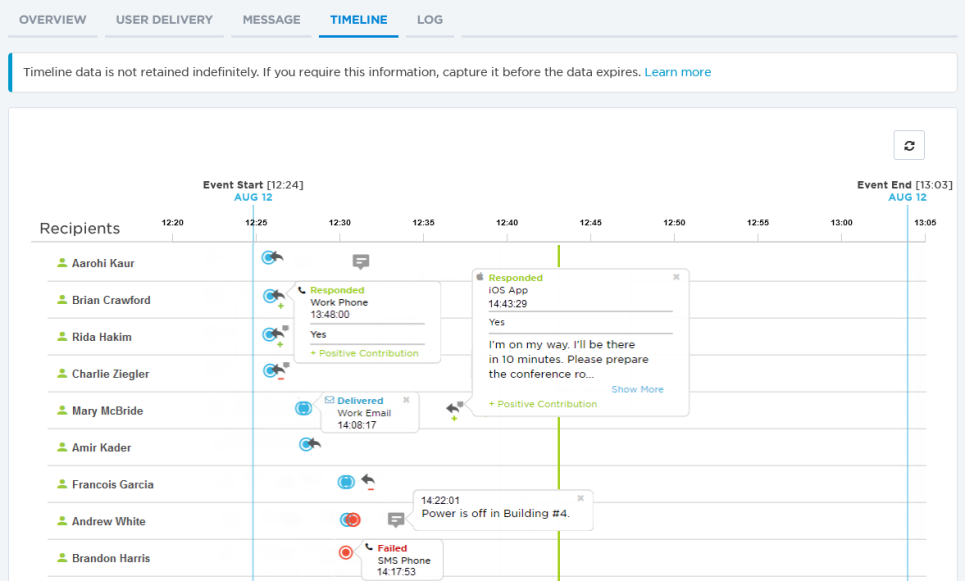
Each recipient is displayed as a row in the timeline, and members of groups are displayed as individual recipients. Icons on the timeline represent communications that occur, such as when a notification was delivered to a user or when a recipient responds to a notification. Click on any icon to see a fly-out with more information about the action it represents, then click again to close the fly-out.
As timeline information is only available for a limited amount of time, the Timeline tab is removed from view once the retention period has expired.
For more information about how to adjust the timeline view and how to interpret the icons, see the Alert Timeline page.
Log
The Log tab provides detailed alert audit information in a format that minimizes the report's impact on system resources. You can use the report to optimize your deployment for alert processing and reporting.

Alert history in the report is also searchable to assist with alert troubleshooting, and includes a page navigation tool that helps you navigate through large reports. You can also use the Export Log button to save report data to an Excel (.xls) file.
As log information is only available for a limited amount of time, the Log tab is removed from view once the retention period expires.
For more information about using and interpreting alert history, see the Log page.
Conference
If your alert includes a conference bridge, the Conference tab provides detailed conference bridge information. You can see who started the call, the number of participants, as well as the conference history and any related alerts.
As conference information is only available for a limited amount of time, the Conferences tab is removed from view once the retention period expires.
For more information about using and interpreting conference data, see the Conferences tab page.
Attachments
If the alert included attachments, the Attachments tab provides an easy way to see and download the attached files.
To download an attachment, click the link in the File Name column.
If you are viewing an archived alert, you can still view a list of the attachments that were included, but the download links are disabled as the files are automatically deleted when the retention period expires.
For more information about managing attachments for an alert, see the Attachments page.
Suppression
If your alert contained suppressed alerts, the Suppression tab provides information about requests correlated to this alert, which had their processing suppressed during an alert flood based on your alert flood control settings.
As suppression information is only available for a limited amount of time, the Suppression tab is removed from view once the retention period expires.
For more information about using and interpreting suppression data, see the Suppression page.


