Manage and resolve an incident
Whatever your role in the incident response process—incident commander, resolver, or stakeholder—the Incident Console lets you clearly see what's going on from the moment an incident is initiated. It displays the critical information you and your teams need to stay aligned, allowing you to prioritize tasks and focus on what's important: resolving the incident.
Having everything in one place means you can easily monitor an incident's progress, collaborate with resolvers, and make relevant updates, all from the same screen. Here, we'll walk you through the entire life cycle of an incident, from hitting the initiate incident button, right through to resolution.
- Initiate an incident
- Review an incident's details
- Explore potential root causes and recent changes
- Link to related active and historical incidents
- Add and manage resolvers
- Run automations
- Join collaboration channels
- Add tasks
- Add attachments
- Link status pages
- Monitor and record progress
- Resolve and view post-incident metrics
- Create a Post-Incident Report
Step 1: Initiate an incident
When an event occurs that impact your business, there are multiple ways you can quickly initiate an incident in xMatters. The way you initiate an incident defines the initial incident, so it's important to remember that the details you enter shape the notification your resolvers receive, depending on how the incident is initiated.
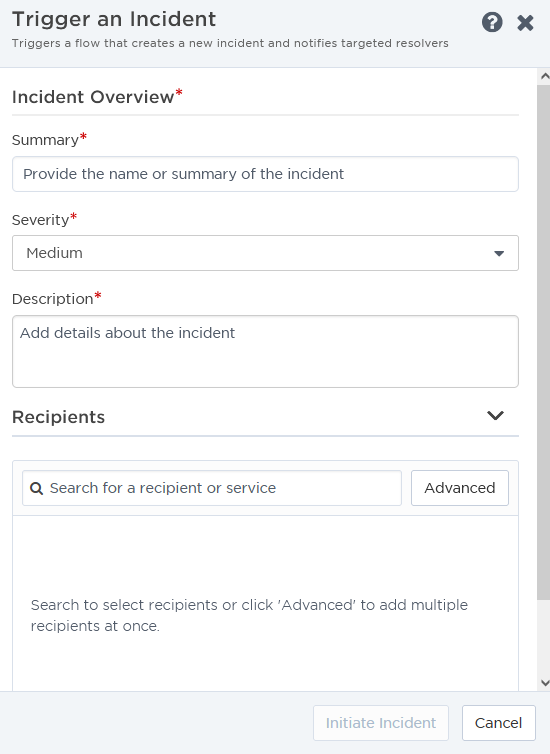
Let's start by initiating our incident. One of the quickest ways to do this is from the Incidents page. If you're working in the web user interface, initiating an incident can be done with the click of a button:
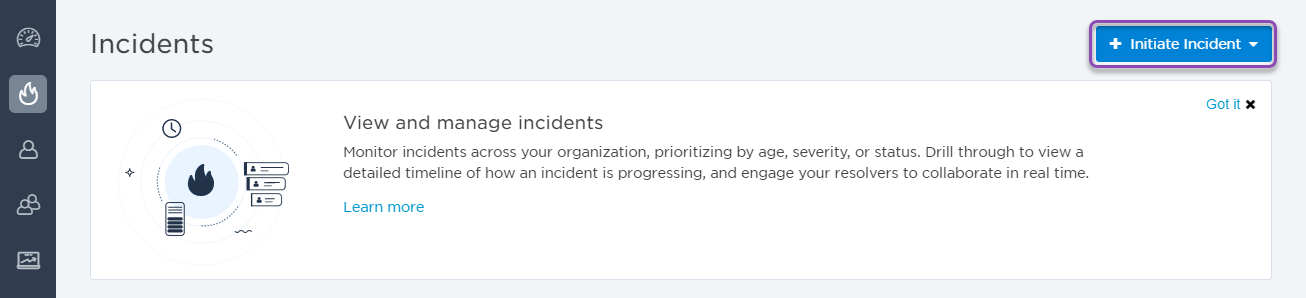
Here, you can easily add key details about the incident, like a summary, description, severity, impacted services, and any resolvers you want to target. This information will be available to view and edit in the Incident Console once the incident is initiated. If you include URLs in the incident description (using HTTP or HTTPS protocol), they'll appear as clickable links in the console.
Alternatively, we can automatically initiate an incident as part of a flow. The Initiate Incident step in Flow Designer allows us to create an incident at any point in a flow, using information from previous steps in the summary and description. We can also connect collaboration channels, like Slack or an xMatters hosted conference call, to the incident workflow.
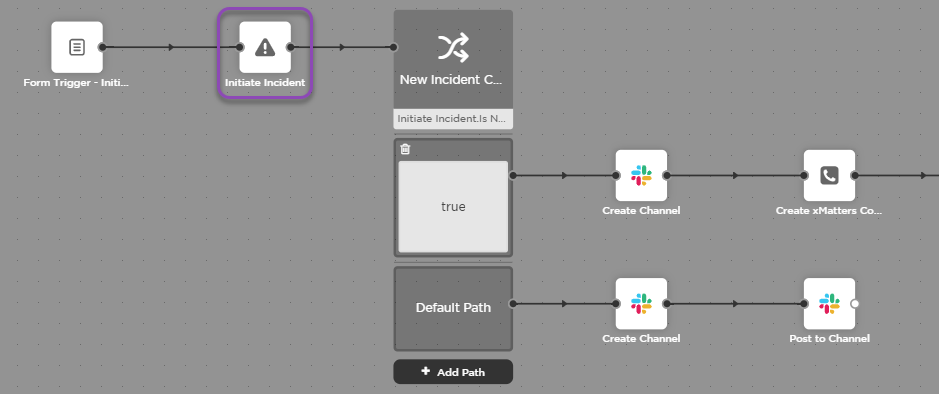
To learn more about connecting the Initiate incident step to your flow in Flow Designer, see Initiate Incident step.
The Initiate Incident Widget can also be used to easily initiate an incident by triggering a flow from your dashboard. For more information about configuring and using the widget, see Initiate Incident Widget.
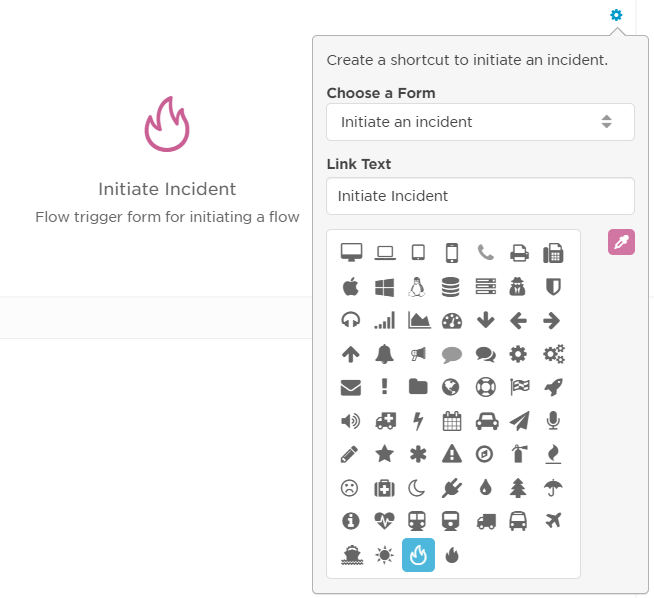
For more details about how to initiate an incident, and the different ways you can do this, see Initiate an incident.
Step 2: Review an incident's information
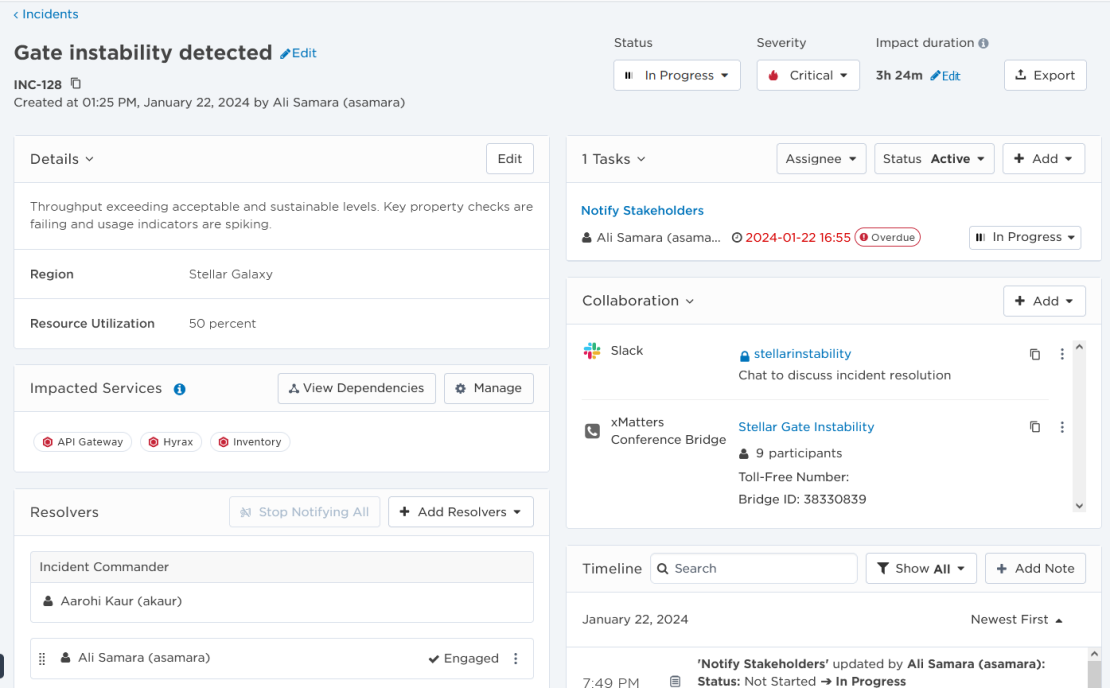
Once you've initiated your incident, you can review and update its information in the Incident Console. The Incident Console displays the key details about the incident, and includes the overview information that was entered when the incident was initiated (like summary, description, incident properties, impacted services, status, and severity). Other details are automatically created (like the incident ID, which is assigned either automatically by xMatters or another system as part of a flow, or manually by the initiator), but some can be edited. For example, by default the impact duration starts when the incident was initiated and ends when the incident status is changed to Mitigated (or the Resolved status, if you bypass Mitigated), but you can change this to match the actual impact duration.
The Incident Console also includes links to any collaboration channels, who is responsible for specific roles, any resolvers who were notified or have engaged, and a timeline that shows any status updates, responses, details, comments, or additional notes received during the incident.
We can edit our incident by clicking Edit next to the information we want to change, or by selecting a new value from a drop-down menu.
Here, we've updated the severity from Medium to Critical, the status from Open to In Progress, and updated the Incident Commander. By default, the Incident Commander resolver role is set to the user who initiated the incident.
If you'd like to learn more about what specific details mean and how to edit them, see Update incident details.
Step 3: Explore potential root causes and recent changes
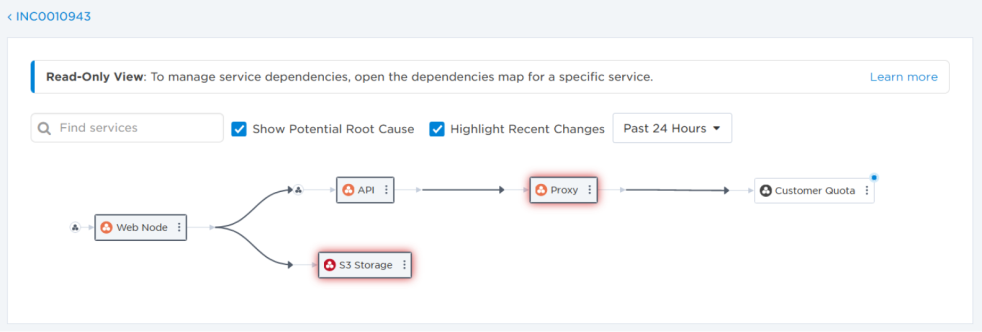
The Impacted Services section of the Incident Console displays services reported as impacted by the incident, and allows you to explore a map of the dependencies between these services and others in your architecture, and identify potential root causes. Since changes are typically the main cause of incidents, the map includes the ability to view recent changes to your services to help identify what actions you should take—such as determining which subject matter experts to engage as resolvers or whether to run an automation like a failover or a rollback.
We can open the incident's service dependency map by clicking View Dependencies in the Impacted Services section of the console. The dependencies map includes options to identify potential root causes and highlight recently changed services. In our incident, although the Proxy service is identified as a potential root cause, we can see that the Customer Quota service it depends on was recently changed. We may want to consider running a rollback automation on this service or engaging its owners as resolvers.
To learn more about using the incident service dependency map, see Dependencies map for an incident.
Step 4: Link to related active and historical incidents
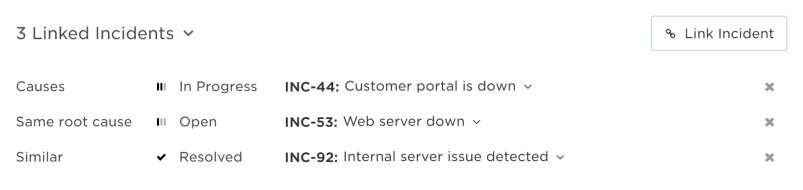
The Linked Incidents section displays links to other active or historical incidents with their corresponding relationship types. You can glean insights from related incidents such as merging resolution teams for similar incidents, reusing steps that were used to resolve a historical incident, or reducing time to mitigate or resolve the incident by combining duplicates.
Expand the Linked Incidents section to view and manage any existing links to related incidents. We can review our incident's relationship to the related incident to see if we can either use similar resolution steps or merge resolution teams.
If you have proper permissions, you can also view information about the related incident by clicking it to open its info card.
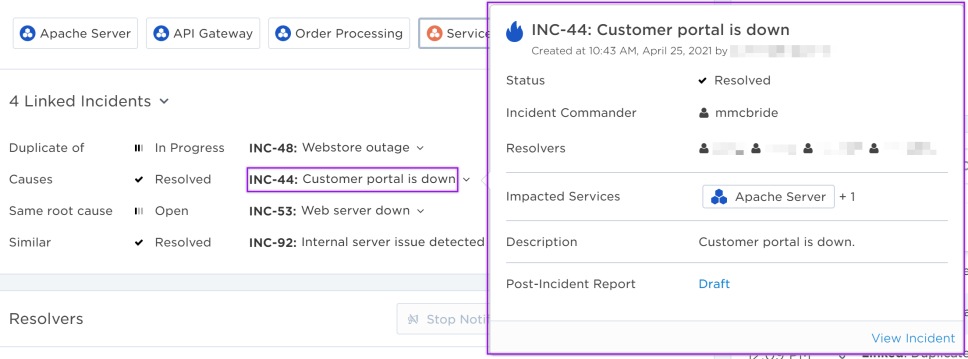
Make sure to check the Insights panel at the top of the Incident Console page for suggestions to link to related incidents.
To learn more about how linking incidents can shorten your resolution time and make the incident management process more efficient, see Incident links.
Step 5: Add and manage resolvers
The Resolvers section of the Incident Console shows who the Incident Commander is, which resolvers have been notified, their response, and if they're engaged in the incident resolution process. If groups were targeted as resolvers, the names of any users who have responded will also be visible here.
As our incident progresses, this section reflects who is actively engaged in the incident resolution process.
We can see that a user from the IT team is engaged, but there is no response from the other team, so we can choose to add new resolvers, or renotify the current resolvers who haven't responded yet.
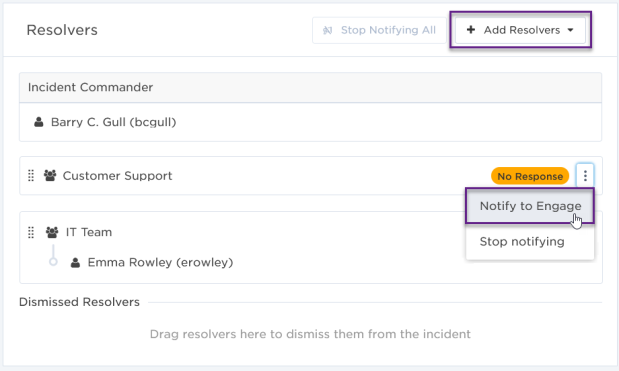
Make sure to check the Insights panel at the top of the Incident Console page for suggestions to add resolvers from similar active or historical incidents and incidents that are linked to your incident. Insights can also suggested adding impacted service owners that haven't engaged in the incident.
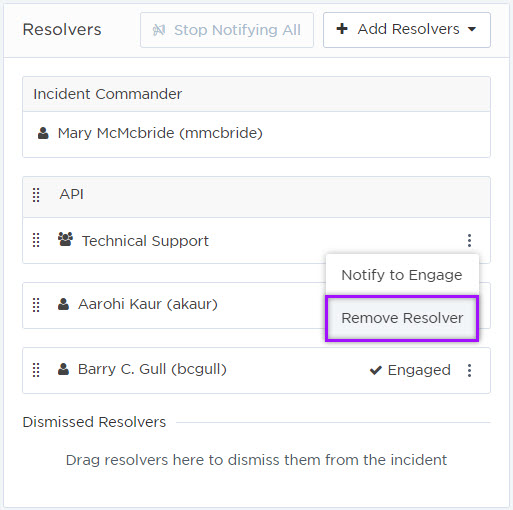
If a resolver is no longer needed, or was added by mistake, you can remove them from the incident. Removing this unnecessary information from the Incident Console helps reduce visual clutter and ensures that everyone is clear about who is involved in the response process for this incident.
Here, we can see which users are engaged with the incident, and who hasn't responded. Let's remove the resolvers who haven't responded so our teams know exactly who is working on this incident. From the options menu, we can select Remove Resolver:
For more information about managing resolvers, see Engage resolvers.
Step 6: Run automations
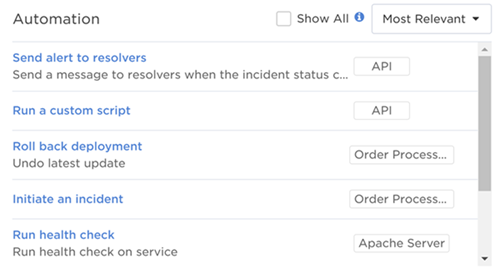
The Automation section provides a list of automations available for the incident. Automations are a quick way to run common tasks related to an incident—such as notifying resolvers, sending alerts, and creating Jira tickets—without interrupting your incident resolution process.
If an incident was initiated by a flow that has an Incident Automation trigger configured in Flow Designer, the Flow Trigger form associated with the trigger will appear as an automation in the Automation section. If there are no automations configured, the Automation section will not appear in the Incident Console.
To learn about how to run automations, or add one to an incident using Flow Designer, see Run automations.
Step 7: Join collaboration channels
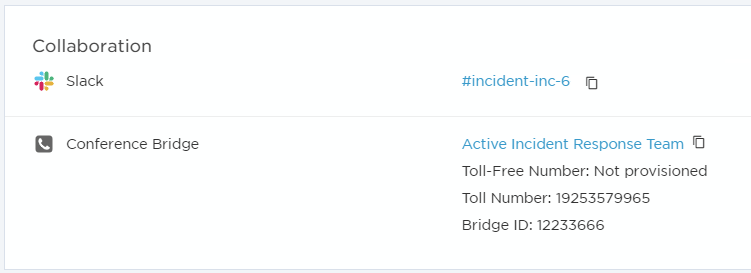
The Collaboration section provides links to the active chat channels and conference bridges resolvers are using to communicate.
If an incident was initiated by a flow that has a collaboration step configured in Flow Designer, the collaboration channels will automatically appear in the Collaboration section. If there are no collaboration channels configured (like in the case of our example incident), the area is blank.
To learn more about how to access collaboration channels, or add one to an incident using Flow Designer, see Collaborations.
Step 8: Add tasks
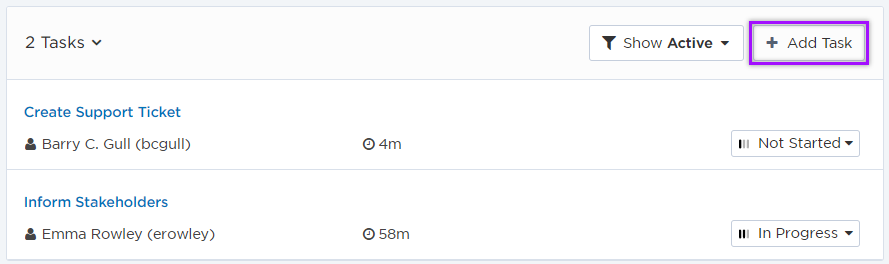
It's important that everyone is on the same page during an incident. The Tasks section allows teams to add and track incident related tasks from within the Incident Console so everyone understands what they need to do and when they need to do it by.
Here we can see that tasks have already been created and assigned to Emma Rowley and Barry C. Gull, how long is left until the task is due to be completed, and their current status (Not Started and In Progress). From here, we can filter the task list, update each task's details (such as its name, description, status, start and due date, and assignee) or add additional tasks if needed at any time during the incident response process.
Step 9: Add attachments
Include additional resources for your resolvers by adding attachments to the incident. An attachment could be a video or screen capture of an error, or procedures that resolvers should use to help resolve an incident more quickly.
Here we can see two of seven attachments added to an incident. From the incident console, you can change the order of the attachments to ensure the most important ones are visible first. You can also add additional attachments, preview an existing file, delete, or download an attachment from the incident console.
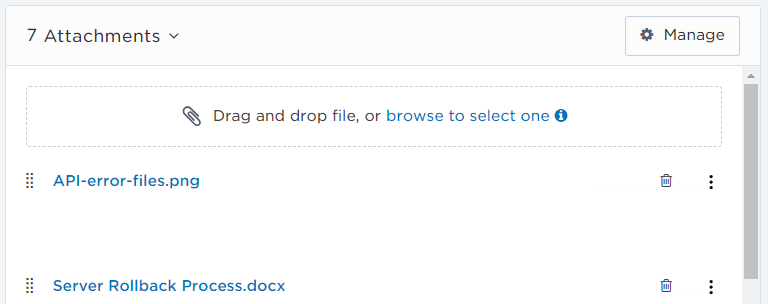
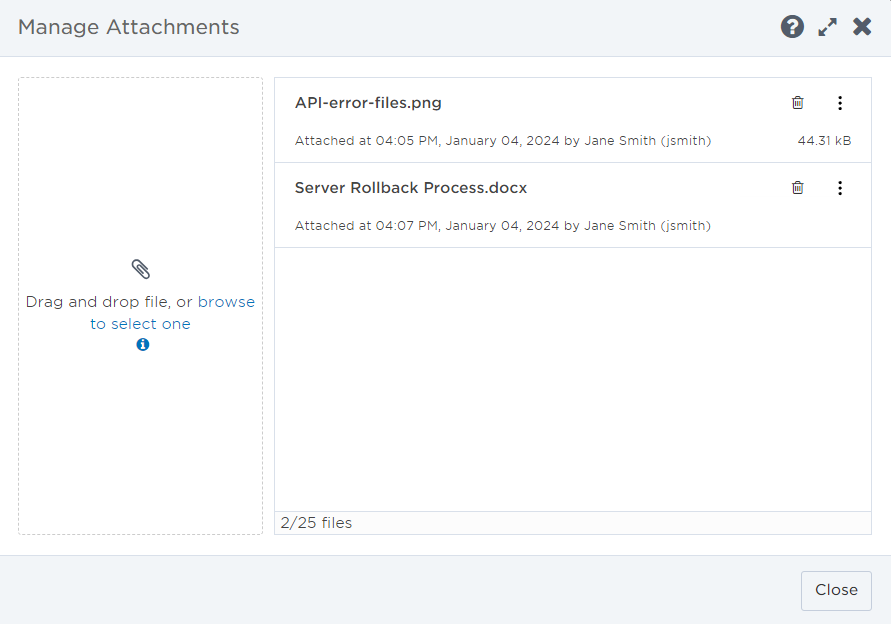
Click Manage to view the list of attachments, edit an attachment name or description, copy a preview link, or delete an attachment.
To learn more about working with attachments, see Manage incident attachments.
Step 10: Link status pages
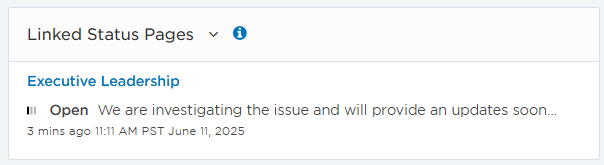
Status pages communicate updates about the incident’s impacted services and resolution process. To ensure they stay accurate, link the relevant status pages to the incident so Incident Commanders and resolvers can easily navigate to a status page directly from the Incident Console. Any changes made to an incident’s details on a status page do not update its details on the Incident Console.
To learn more about working with linked status pages, see Manage linked status pages.
Step 11: Monitor and record progress
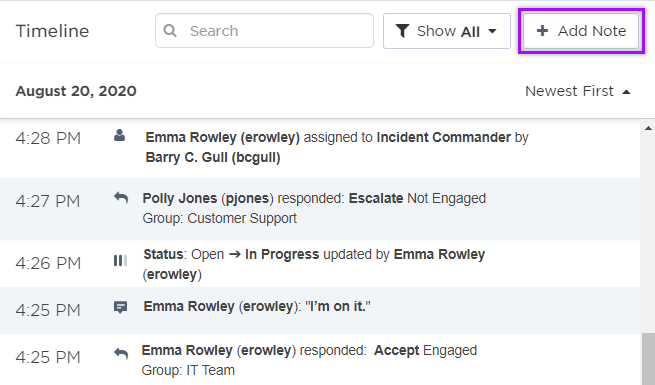
The best way to monitor an incident's progress is through the incident Timeline. This displays all the changes and comments made during the lifetime of the incident. You can filter the timeline by Notes, Resolvers, Attachments, or Updates to find specific results.
Here we can see when our incident was created, the response and comments from Emma Rowley and Polly Jones, the change in status from Open to In Progress, and the change in incident commander. We can also add a note to the timeline to communicate extra information to resolvers by clicking the Add Note button.
To learn more about working with the timeline, see Timeline.
Step 12: Resolve and view post-incident metrics
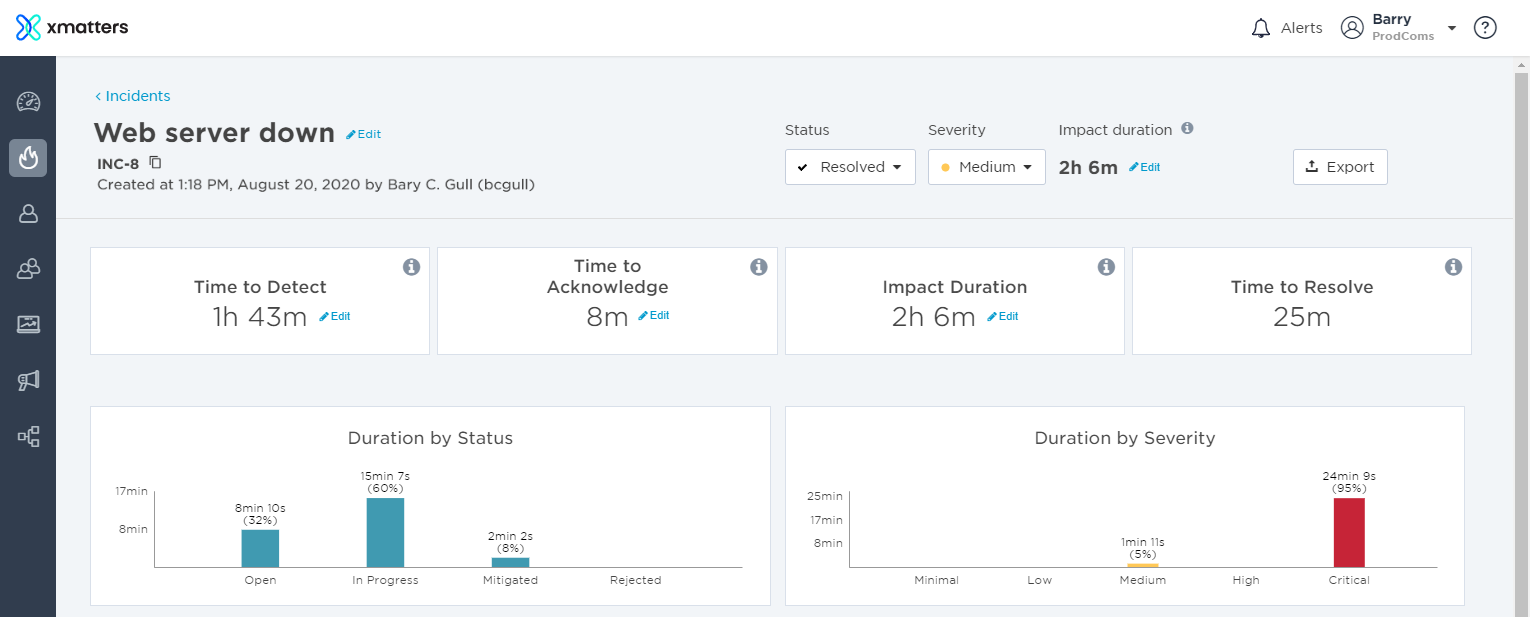
Once an incident is resolved, the incident metrics are added to the top of the Incident Console, so stakeholders can review how the incident progressed. This allows you see a clear summary of the incident's data and perform a detailed analysis of an incident's lifetime. Once you've reviewed the data, you can easily export it for further reporting or filing purposes.
Now we've updated the incident's status to Resolved, the post-incident metrics are displayed at the top of the screen. Once we've reviewed the data and made any updates where necessary, we can click Export to export the data into a spreadsheet.
For more information about the incident metrics, or to understand how they're calculated, see incident metrics.
Step 13: Create a Post-Incident Report
Finally, Advanced plan customers can create a Post-Incident Report. This allows you to share information about the response process with stakeholders, and help your team understand what went wrong and what can be improved on to ensure a the incident doesn't reoccur. Fill out the Analysis, Timeline, and Actions sections to complete a detailed retrospective and assign any required post-incident activity.
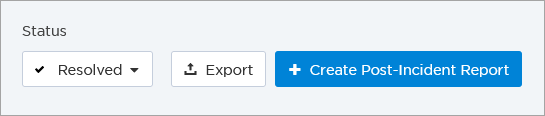
On the incident console, click Create Post-Incident Report to create the report:
When we first create the report, the sections will be blank. From here, we can add information to the Analysis section, add in relevant entries from the incident timeline, and create post-incident actions which can be tracked in xMatters:
![]()
To learn about how to complete the sections of the report, see Post-Incident Report.